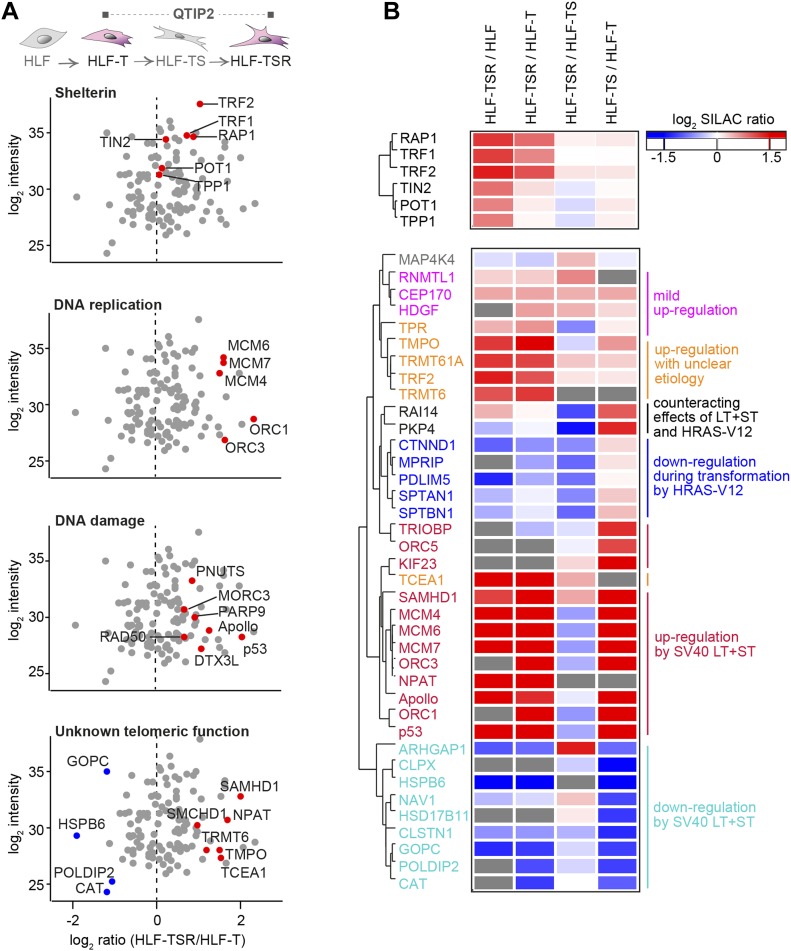
Figure 3. Identification of transformation-responsive telomeric proteins.
(A) Scatter plots for QTIP2 showing differences in telomere recruitment between HLF-T and HLF-TSR cell lines. Plotted are mean values from the forward and reverse TRF IP replicates. See also Fig S5. (B) Heatmap of differentially regulated telomeric proteins. Top panel: shelterin proteins; bottom panel: putative telomeric proteins that were significantly up-/down-regulated in TRF IP in at least one QTIP (Significance B, both sides, P < 0.05). Missing values are displayed in gray.

