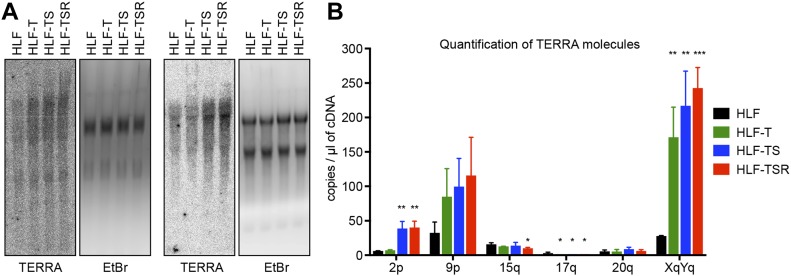
Figure 4. TERRA levels are elevated during transformation.
(A) Northern blot analysis of total RNA from the HLF-derived cell lines. TERRA was detected using a telomeric DNA probe complementary to the UUAGGG repeats. Ethidium bromide (EtBr) staining is shown as a loading control. Two independent biological replicates are shown. (B) TERRA quantification by RT–qPCR with primers specific for the indicated subtelomeric sequences. Plotted is mean + SD from three biological and two technical replicates. Two-tailed unpaired t test, comparing all derived cell lines with primary HLFs (*P < 0.05; **P < 0.01; ***P < 0.001; bars lacking asterisks are not significant).

