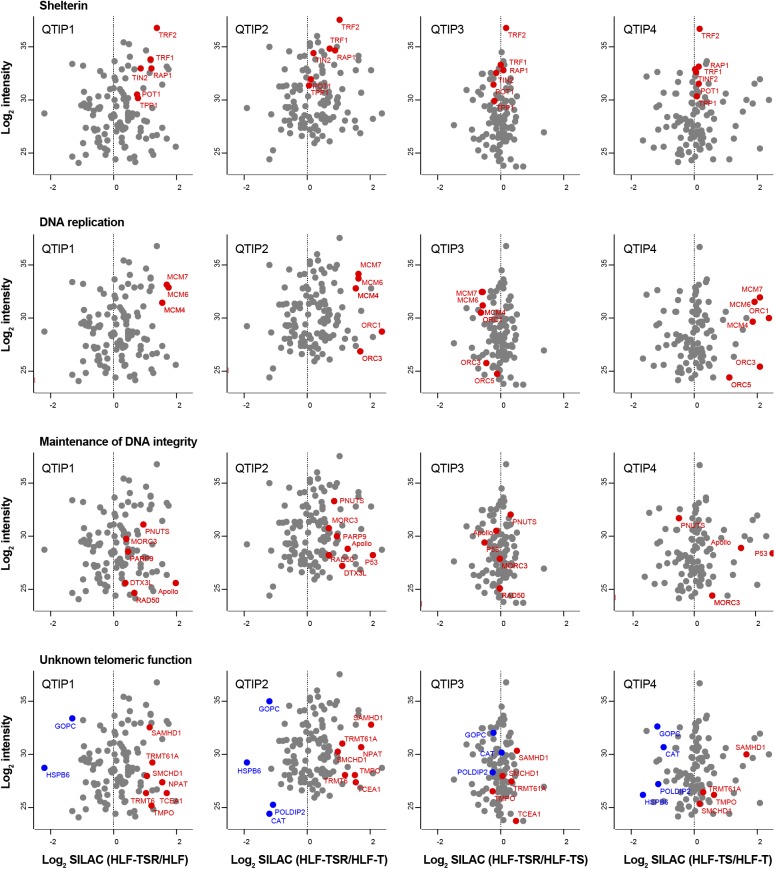
Figure S5. Cellular transformation alters telomere protein composition (related to Fig 3).
Scatter plots for QTIPs showing differences in telomere recruitment between indicated cell lines. Plotted are mean values from the forward and reverse TRF IP replicates. A dataset of 134 telomeric proteins (Table S1, list B) was used for the plots.

