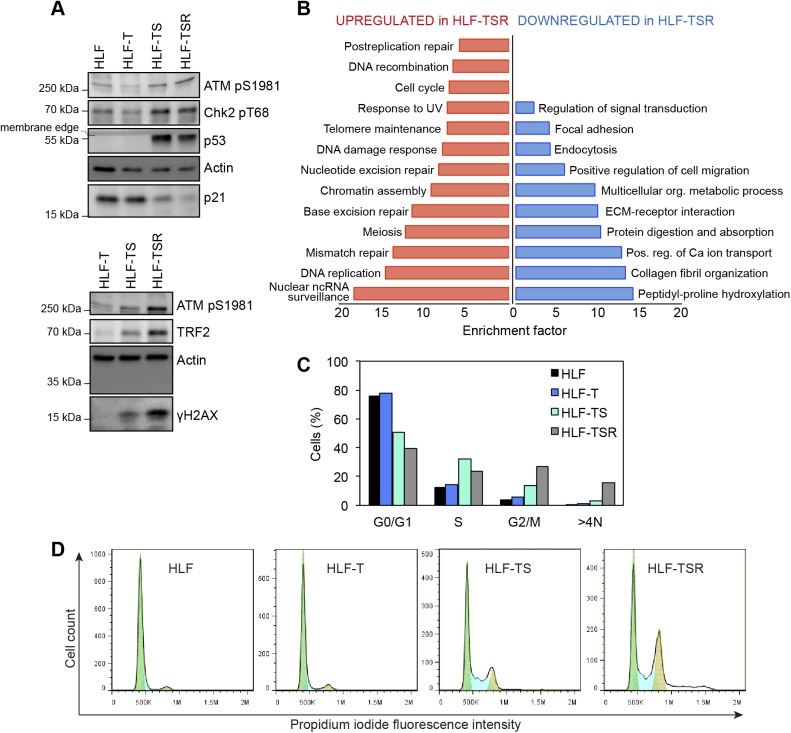
Figure S6. Cellular transformation is associated with increased DNA damage burden and hyperproliferation.
(A) Immunoblot analysis of DDR, performed on whole-cell lysates. Actin is used as a loading control. (B) Gene annotation enrichment analysis of proteins that were significantly up- or down-regulated in chromatin-enriched extracts from HLF-TSR when compared with HLF-T. The extracts were analyzed in two biological and two technical replicates, and the mean HLF-TSR/HLF-T SILAC ratios were tested for outliers (Significance B, respective side, P < 0.05). This produced datasets of 85 up-regulated and 91 down-regulated proteins that were separately tested for enriched gene annotation terms when compared with the full dataset of 1,537 proteins (Fisher’s exact test, Benjamini–Hochberg FDR < 0.02). Plotted are overrepresented “KEGG pathway” and “GO Biological Process” categories. (C, D) Cell cycle profiles of HLF-derived cell lines. Cells were analyzed by flow cytometry after propidium iodide staining. The percentages of cells in G0/G1, S, and G2/M phases were determined using the Watson Pragmatic computational model in FlowJo.

