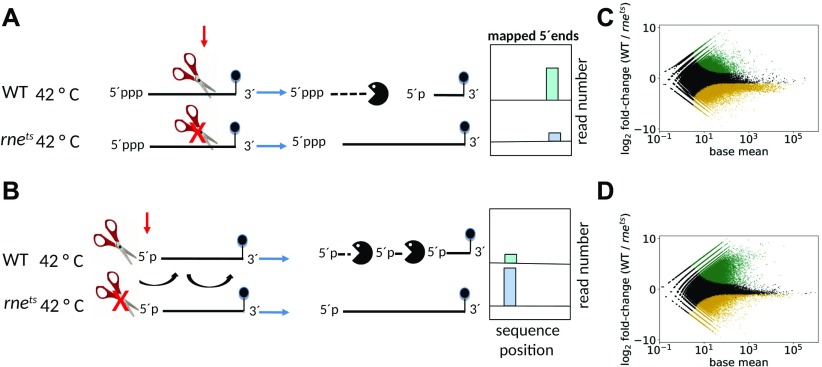
Figure 1. Generation of stable 5′ ends in wild type and 2.4.1rneE. coli(ts) strains of R. sphaeroides.
(A) Internal cleavage by RNase E. The ends of primary transcripts are protected from degradation by a triphosphate at their 5′ end and by secondary structures (often terminators) at their 3′ end. Internal cleavage of RNase E generates an unprotected 3′ end, which allows rapid degradation by 3′–5′ exoribonucleases. The new monophosphorylated 5′ end is a new target for RNase E. The 5′ end stemming from RNase E cleavage is accumulated in the wild type at the nonpermissive temperature. (B) 5′ end–dependent degradation by RNase E. RNase E can bind to monophosphorylated 5′ ends if a stretch of unpaired nt is present and will subsequently introduce cleavages in an overall 5′–3′ direction. The 5′ monophosphate ends can stem from previous RNase E cleavage, from cleavage by other endoribonucleases, or by the action of a pyrophosphohydrolase. The 5′ monophosphate end is enriched in the rne mutant strain compared with the wild type at the nonpermissive temperature. Global analysis of 5′ end profiles at a permissive (32°C) (C) and a nonpermissive temperature (42°C) (D). The plots show average first-base-in-read-coverage level in wild-type samples compared with 2.4.1rneE. coli(ts) samples and the relative log2 fold change. The x axis (base mean) represents the average, library-size normalized coverage values, whereas the y axis (fold change) represents the ratio of the normalized coverage values of the mutant in comparison with the wild type (both base-means and fold changes were calculated by DESeq2). The green dots represent sites with a significant (i.e., Benjamini–Hochberg adjusted, P < 0.05) enrichment in the wild type, whereas the brown dots represent sites with a significant enrichment in the mutant. Black dots represent sites without a significant enrichment.

