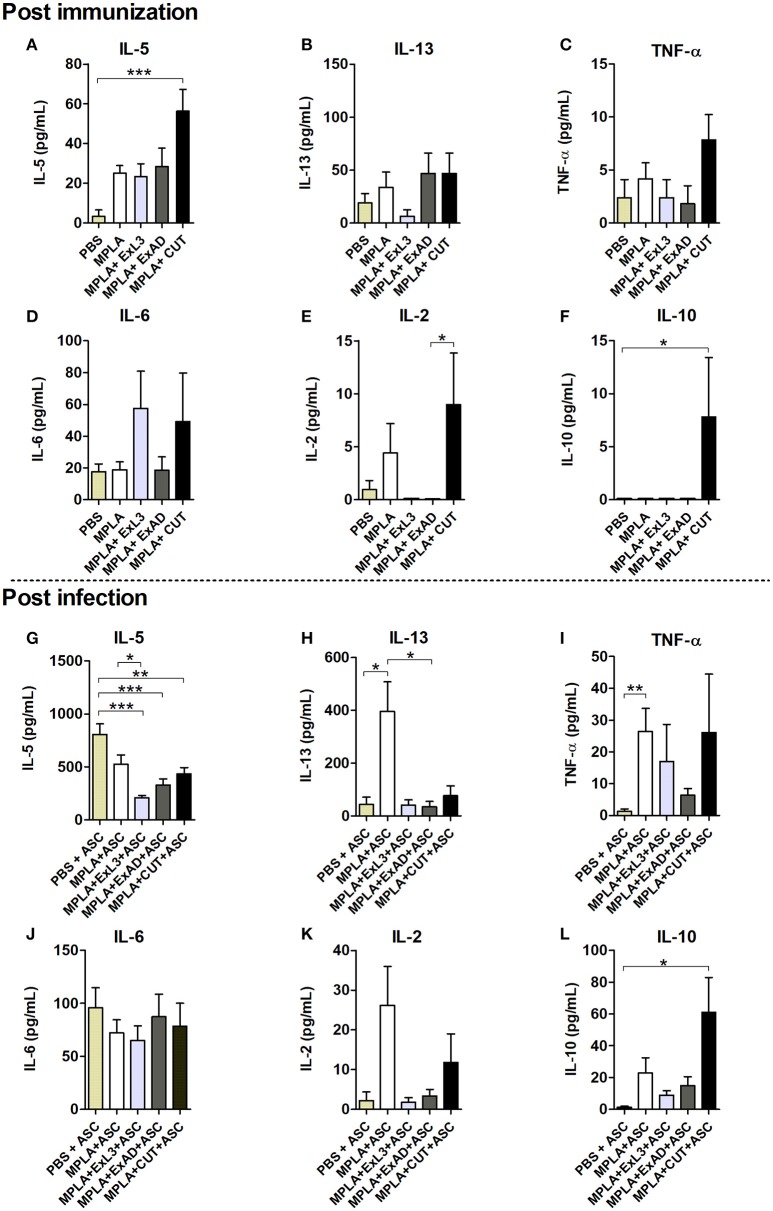
Figure 3.
Systemic cytokine levels induced by immunization with different A. suum extracts following infection. Upper panel Post immunization—Determination of systemic cytokine levels by ELISA after immunization with antigens. (A) IL-5. (B) IL-13. (C) TNF-α. (D) IL-6. (E) IL-2. (F) IL-10. Bottom panel Post infection—Determination of systemic cytokine levels after immunization with antigens and infection with A. suum. (G) IL-5. (H) IL-13. (I) TNF-α. (J) IL-6. (K) IL-2. (L) IL-10. Statistically significant differences (p < 0.05) were plotted compared to the controls groups PBS and PBS-ASC in which *p < 0.05, **p < 0.01, ***p < 0.001.

