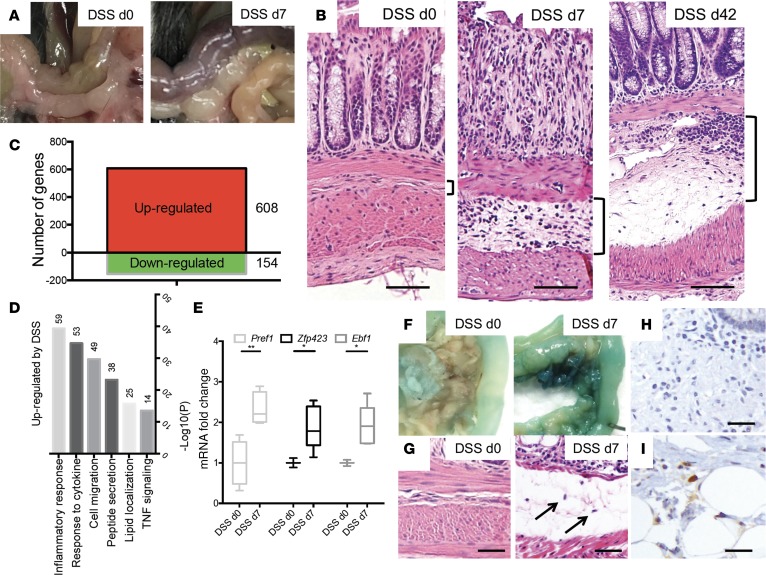
Figure 2. An increase in adipose occurs during experimental colitis.
(A) Representative anatomical and (B) histological images of the distal colon from mice at day 0 and day 7 or 42 days after being provided with 3% DSS in drinking water. Tissue was stained with hematoxylin and eosin. Brackets delineate submucosal region occupied by adipocytes. Scale bar: 50 microns. (C) Transcripts identified by RNA sequencing to be increased or decreased after 7 days of DSS (2-fold change vs. normal colon). (D) Gene ontology analysis of the upregulated genes by DSS treatment. (E) Reverse transcription qPCR (RTqPCR) of the relative abundance of transcripts for Pref1, Zfp423, and Ebf1, as normalized to β-actin (n = 5 mice/group). Data in E is represented using box-and-whisker plots, with boxes representing the IQR, lines representing the median value, and whiskers representing minimum and maximum values; *P < 0.05, **P < 0.01, and ***P < 0.001 (Student’s t test). (F and G) β-Gal staining of the Zfp423LacZ/+ mice colon 7 days after DSS. (H) Representative histology of uninvolved Crohn’s disease human patient tissues stained with anti-PREF1/DLK antibody. Scale bar: 10 microns. (I) Representative histology of involved Crohn’s disease human patient tissues stained with anti-PREF1/DLK antibody. Scale bar: 10 microns.

