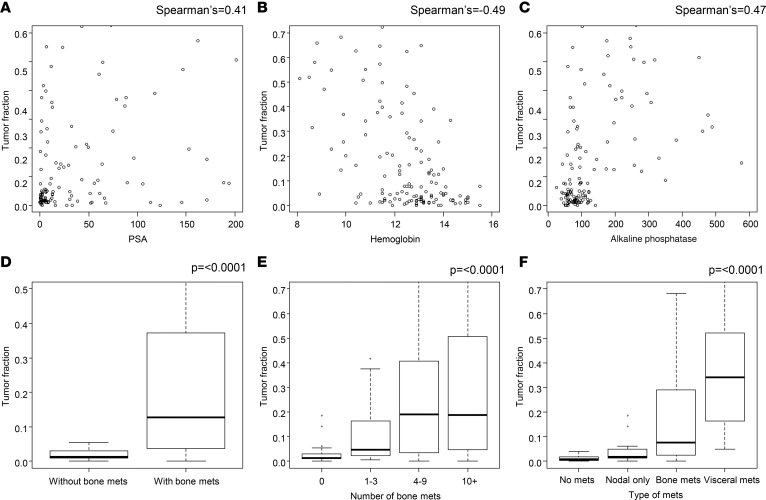
Figure 2. Correlation of TFx with clinical features.
(A–C) Scatter plots depicting the relationship between TFx at the time point during longitudinal monitoring when the highest TFx value was seen with PSA (A), hemoglobin (B), and alkaline phosphatase (C) at that time point. Each dot represents an individual patient (n = 140). Spearman correlation coefficients are noted in the corner of each plot. (D–F) Box plots depicting the relationship between TFx at the time point during longitudinal monitoring when the highest TFx value was calculated with presence or absence of bony metastases by skeletal scintigraphy (n = 140) (D), number of bony metastases detected by skeletal scintigraphy (n = 140) (E), and site(s) of metastasis detected by bone scintigraphy and/or CT imaging at that time point (n = 138) (F). “Nodal only” denotes macrometastatic disease involving lymph nodes but not distant bony or visceral sites. “Bone only” denotes metastatic disease involving bone (+/– lymph nodes) but not distant visceral sites. “Visceral mets” denotes involvement of distant visceral sites (liver, lung, brain, adrenal gland) and does not include extension of local disease (i.e., to bladder/ureter or rectum.) Each patient is represented by a single value within the box plots in each figure (i.e., no patient is represented more than once). Two-sided P values per Wilcoxon rank sum test.

