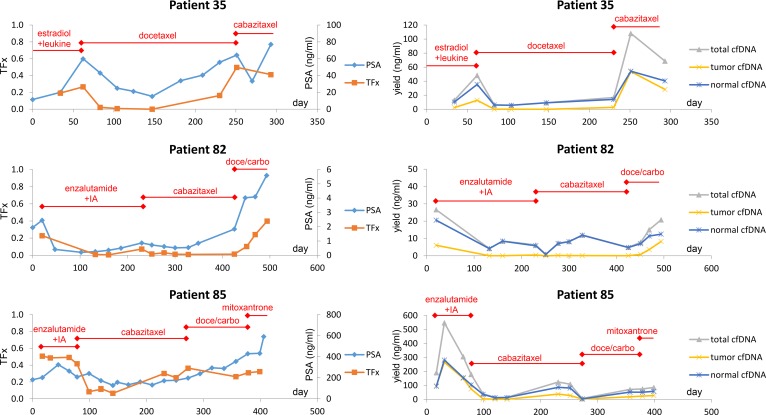
Figure 3. Tumor fraction and cfDNA yield with PSA over time in 3 patients receiving chemotherapy.
Left panels: Depiction of TFx (orange markers, left axis) and PSA (blue markers, right axis) over time (measured in days) for 3 patients in the cohort treated with chemotherapy. Start and stop dates for treatments are depicted with a diamond; lines continuing to the edge of the graph without a diamond denote that the therapy was initiated prior to the time points depicted in the graph or completed after the time points depicted in the graph. IA, investigational agent. Two markers from the same time point on day 120 for patient 85 denote replicates from the same cfDNA isolate but with independent library construction and sequencing steps. Right panels: Depiction of total cfDNA yield (in ng/ml of plasma, lavender), tumor DNA yield (TFx × total cfDNA yield, orange), and noncancerous (“normal”) DNA yield ([1 – TFx] × total cfDNA yield, blue) in the same 3 patients over time. Note that the scales of total cfDNA yield (y axes) are different for the 3 patients.

