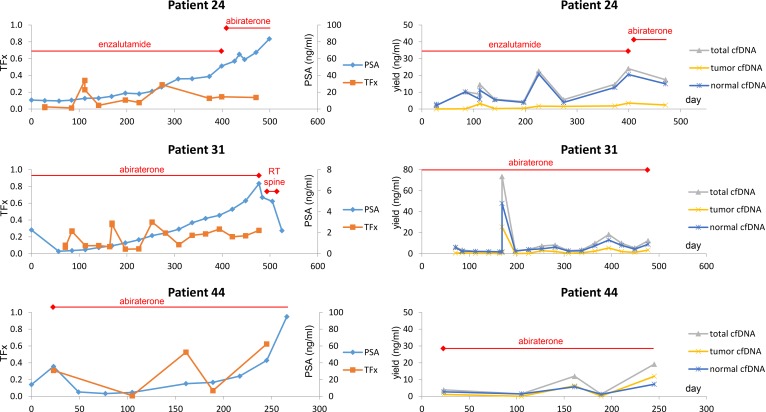
Figure 5. Tumor fraction and cfDNA yield with PSA over time in 3 patients receiving AR-targeted therapy.
Left panels: Depiction of TFx and PSA over time for 3 patients in the cohort treated with abiraterone or enzalutamide for >100 days with rising PSA. Two markers from the same time point on days 28 and 112 for patient 24, and on day 85 for patient 31, denote replicates from the same blood draw but with independent cfDNA isolation, library construction, and sequencing steps. Two markers from the same time point on day 71 for patient 31 denote replicates from the same cfDNA isolate but with independent library construction and sequencing steps. Right panels: Depiction of total cfDNA yield, tumor DNA yield, and noncancerous (“normal”) DNA yield over time in the same 3 patients.

