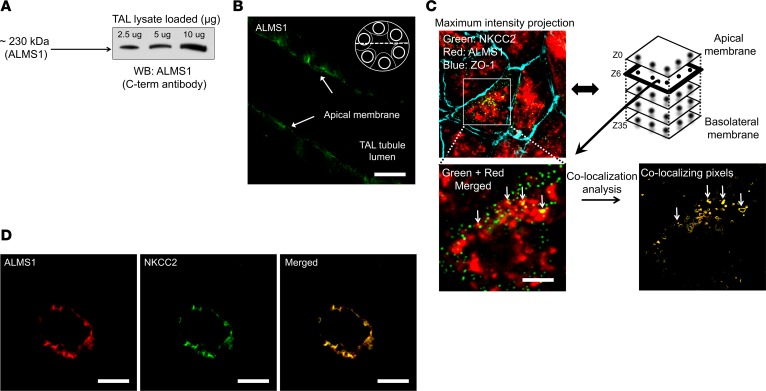
Figure 2. Expression and colocalization of ALMS1 and NKCC2 in rat TAL.
(A) Representative immunoblot of ALMS1 indicating ALMS1 protein expression in rat thick ascending limb (TAL) corresponding to 230 kDa protein; n = 4. (B) Representative image for immunofluorescent labeling of ALMS1 in isolated, perfused TAL, indicating apical and subapical vesicular localization of ALMS1 by confocal imaging in a cross-section of TAL; n = 3. Scale bars: 5 μm. (C) Representative image for immunofluorescent labeling of NKCC2 and ALMS1 in rat TAL primary cultured cells; n = 3. NKCC2 (green); ALMS1 (red); tight junction protein zonula occludens 1 (blue). Merged image from a subapical plane (1.5 μm from the apical plane) showing overlap of internalized NKCC2 and ALMS1 indicated with an arrow. Scale bars: 5 μm. (D) Representative image for immunofluorescent labeling of NKCC2 (green) and ALMS1 (red) in a single TAL cross-section obtained from perfusion-fixed rat kidney slices (n = 4). Scale bars: 10 µm.

