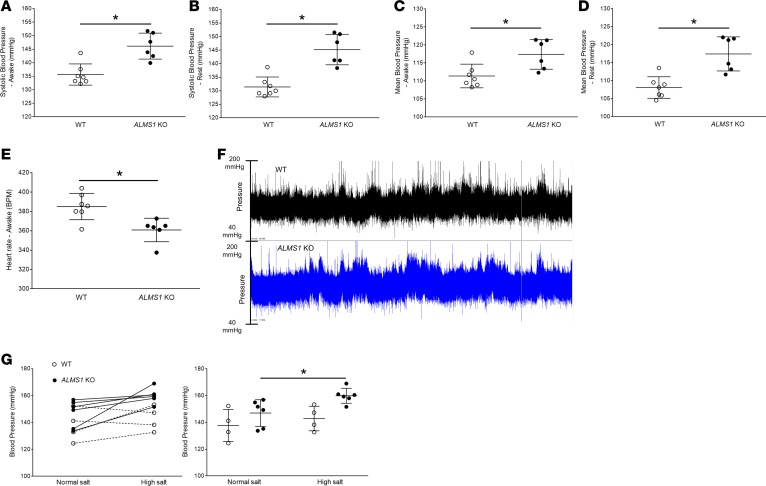
Figure 4. Hypertension in ALMS1-KO rats.
(A) On a normal salt diet, systolic blood pressure (SBP) measurement by radiotelemetry in awake rats indicated ALMS1-KO rats are hypertensive (SBP ALMS1-KO, 146.1 ± 2 mmHg, n = 6, vs. WT, 135.6 ± 1.5 mmHg, n = 7; *P < 0.001). (B) Systolic blood pressure measurement by radiotelemetry indicated that ALMS1-KO rats are hypertensive during their rest period (SBP ALMS1-KO, 145.2 ± 2.3 mmHg, n = 6, vs. WT, 131.4 ± 1.6 mmHg, n = 7; *P < 0.005). (C) Mean blood pressure (MBP) measured by radiotelemetry in awake rats indicated a higher MBP in ALMS1-KO rats (MBP ALMS1-KO, 117.4 ± 1.7 mmHg, n = 6, vs. WT, 111.4 ± 1.3 mmHg, n = 7; *P < 0.01). (D) Mean blood pressure (MBP) measured by radiotelemetry in rats indicated higher MBP in ALMS1-KO during their rest period (MBP ALMS1-KO, 117.4 ± 2 mmHg, n = 6, vs. WT, 108.1 ± 1.3 mmHg, n = 7; *P < 0.01). (E) Heart rate (HR) measured in awake rats indicated a lower HR in ALMS1-KO rats (HR ALMS1-KO, 360.8 ± 5.2 bpm, n = 6, vs. WT, 385 ± 5.6 bpm, n = 7; *P < 0.01). (F) Representative 24-hour telemetry tracing for 1 WT and ALMS1-KO rat fed with normal salt diet. (G) Systolic blood pressure measurement in awake rats during normal salt (NS) intake and after 7 days on high salt (HS) intake (NS ALMS1-KO, 149.7 ± 4.76 mmHg, vs. HS ALMS1-KO, 162.86 ± 3.82 mmHg, n = 6; *P < 0.05) and (NS WT, 137 ± 5.2 mmHg, n = 6, vs. HS WT, 142.5 ± 4 mmHg, n = 4). Both graphs are different representations of the same data set. Values represent mean ± SEM, and statistical analysis was performed with Student’s 2-tailed t test and 2-way ANOVA (salt sensitivity).

