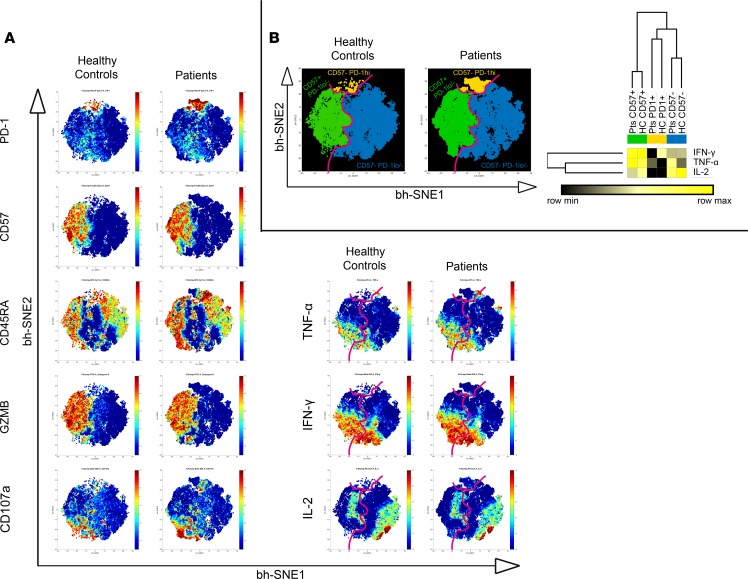
Figure 2. Senescence and exhaustion phenotypes coexist in AML CD8+ T cells.
(A and B) Multidimensional single-cell analysis of PB CD8+ T cells from AML patients before treatment (n = 13) and HCs (n = 13). (A) Bidimensional map obtained from flow cytometric data using the bh-SNE algorithm (pooled data sets). Each point in the map represents an individual cell, and the cells are colored according to the intensity of expression of individual markers, as indicated on the color scale to the right of individual maps. (B) Summary map (left) with lines drawn to separate the CD57+ (green), CD57– (blue), and CD57–PD-1hi (yellow) populations. Heatmap (right) represents the percentage of cells in the CD8+CD57+, CD8+CD57–, and CD8+PD-1hi clusters that express IFN-γ, TNF-α, and IL-2, for AML patients and HCs. Clustering analysis and heatmap were generated using Morpheus software.

