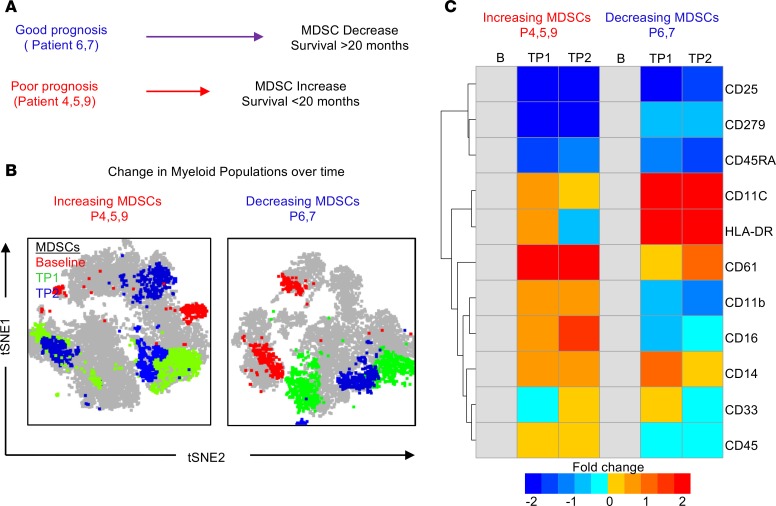
Figure 4. In-depth CyTOF analysis of patients with differing prognoses identifies shifts in MDSCs and other immune populations.
(A) Schematic representation of the 2 groups used for in-depth manual gating analysis (patients 6 and 7 vs. patients 4, 5, and 9). Patients 6 and 7 had a good prognosis (survival >20 months after diagnosis) and decreasing MDSCs as identified by flow cytometry, while patients 4, 5, and 9 had a poor prognosis (survival <20 months after diagnosis) and increasing MDSCs as identified by flow cytometry. (B) tSNE analysis of CD33+ myeloid cells over time at baseline, time point 1, and time point 2, where manually gated myeloid cells were overlaid and colored according to their time points (baseline, red; time point 1, green; time point 2, blue). (C) Myeloid cells of patients in both groups were examined for fold change in myeloid markers from baseline using the CyTOF panel.

