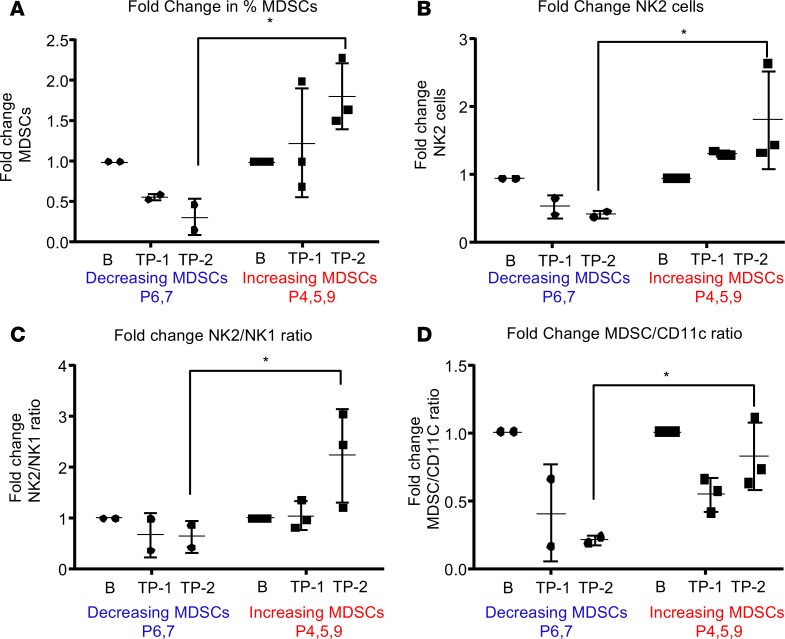
Figure 5. DCs and antigen-presenting cells are increased in a patient with a good prognosis.
(A–D) Manual gating of MDSCs, NK2, NK1, and DC populations from the decreasing MDSCs group and the increasing MDSCs group at baseline (B), time point 1 (1), and time point 2 (2), where B is baseline, 1 is 2 months after diagnosis, and 2 is the final time point collected. Graphs represent data as mean ± SD.

