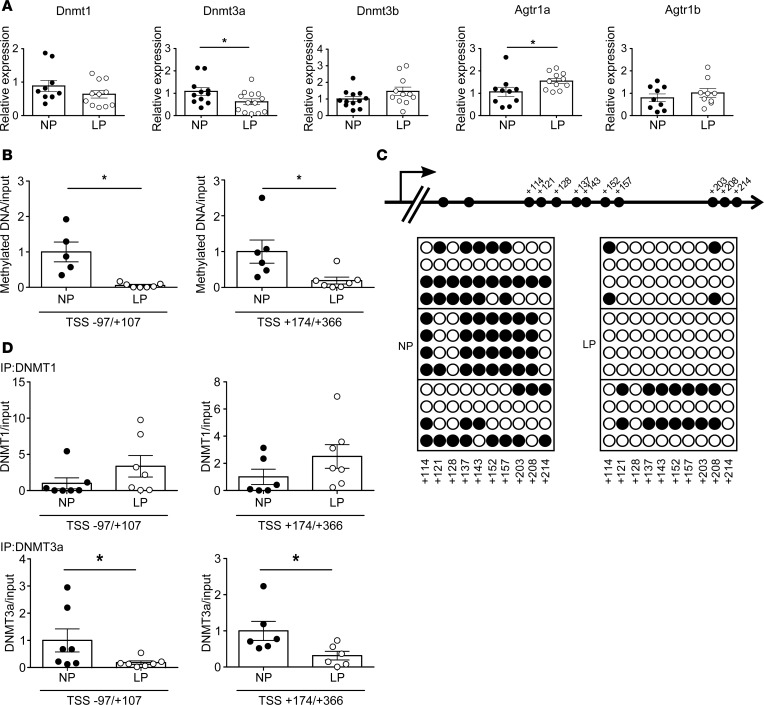
Figure 2. Offspring of pregnant rats treated with a low-protein diet (LP).
(A) mRNA levels of Dnmt1 (n = 8–11), Dnmt3a (n = 11–13), Dnmt3b (n = 12), Agtr1a (n = 9), and Agtr1b (n = 10) in NP-treated or LP-treated offspring. Filled circles, NP group; open circles, LP group. (B) Quantitation of DNA methylation (by MeDIP) at the Agtr1a locus in regions –97/+107 and +174/+366 relative to the transcription start site (TSS) in NP-treated (n = 5 for –97/+107; n = 6 for +174/+366) and LP-treated (n = 7) offspring. (C) Bisulfite sequence analysis of the Agtr1a locus in the PVN from 12-week-old NP-treated or LP-treated offspring. Top, schematic diagram of the Agtr1a locus. Dashes and numbers indicate the positions of the cytosine residues of CpG dinucleotides relative to the TSS (+1). Bottom, DNA methylation status of the CpG sites between +114 and +214 bp relative to the TSS. Filled circles, methylated CpG sites; open circles, demethylated CpG sites. (D) ChIP assays showing DNMT1 (top) and DNMT3a (bottom) binding to the regions –97/+107 (n = 7 and 7 for DNMT1; n = 9 and 11 for DNMT3a) and +174/+366 relative to the TSS (n = 6 and 7 for DNMT1; n = 10 and 8 for DNMT3a, NP and LP, respectively), in the PVN of NP-treated and LP-treated offspring. Filled circles, NP-treated offspring; open circles, LP-treated offspring. Throughout, data represent means ± SEM. *P < 0.05 versus control offspring (t test).

