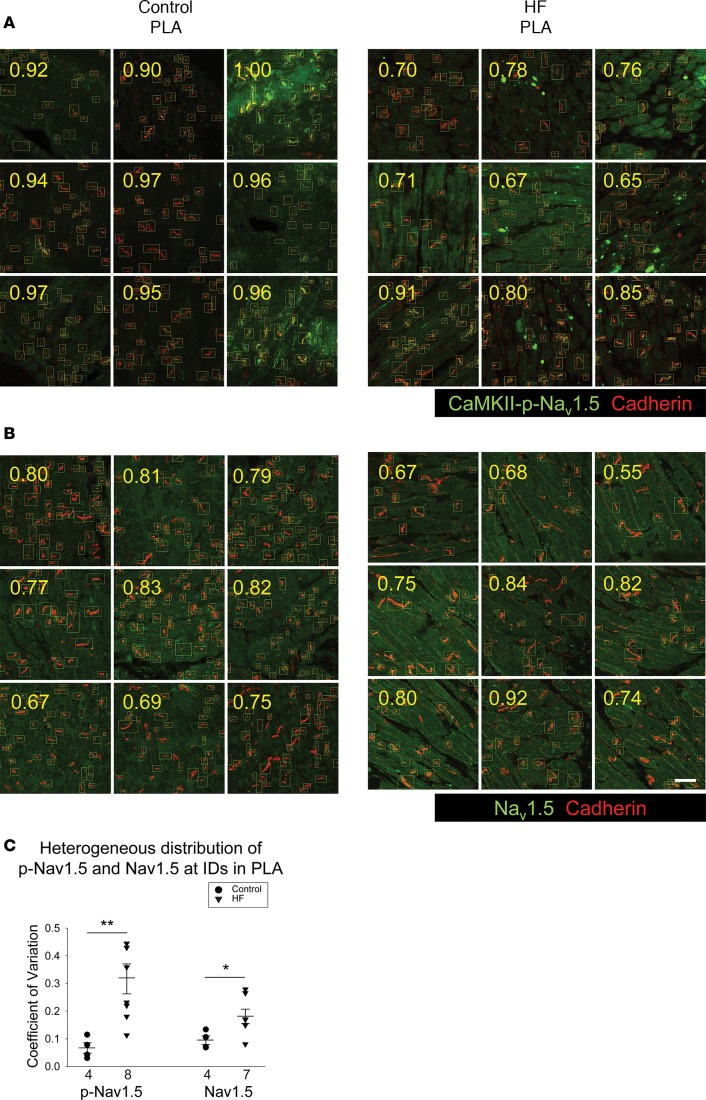
Figure 7. Increase in spatial heterogeneity of distribution of CaMKII-p-Nav1.5 (S571) in HF PLA.
(A and B) More heterogeneous distribution of CaMKII-p-Nav1.5 (S571) (A) and Nav1.5 (B) in HF PLA, compared with control PLA in random nine 40× confocal images. Each number (yellow) represented the ratio of labeling frequency of CaMKII-p-Nav1.5 (S571) (A, green) and Nav1.5 (B, green) against cadherin (red) at ID. Scale bar: 40 μm. (C) Comparison of spatial distribution of CaMKII-p-Nav1.5 (S571) and Nav1.5 in control and HF PLA. Note that CaMKII-p-Nav1.5 (S571) was more heterogeneously distributed than Nav1.5 in HF PLA. Data are represented as mean ± SEM. *P <0.05, **P < 0.01. Independent t tests. HF, heart failure; PLA, posterior left atrium; ID, intercalated disc.

