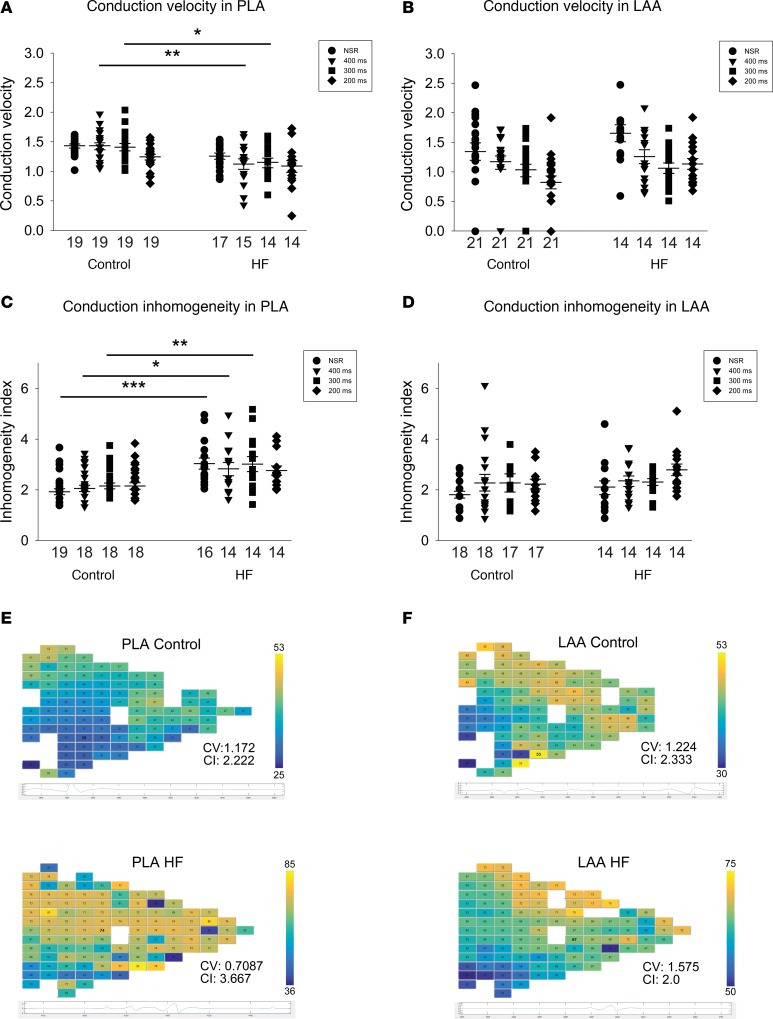
Figure 8. Change in conduction velocity and conduction inhomogeneity in PLA and LAA by ventricular tachypacing induced HF.
(A and B) Conduction velocity was decreased at 400 ms and 300 ms cycle length in PLA after 3 weeks of ventricular tachypacing, but not in LAA. (C and D) Conduction inhomogeneity was increased at NSR, 400 ms, and 300 ms cycle length in PLA after 3 weeks of ventricular tachypacing, but not in LAA. (E and F) Representative examples of activation maps in the PLA and LAA, respectively. Data are represented as mean ± SEM. *P < 0.05, **P < 0.01, ***P < 0.001. Repeated measures 2-way ANOVA with Bonferroni adjusted within cycle comparisons. HF, heart failure; PLA, posterior left atrium; LAA, left atrial appendage.

