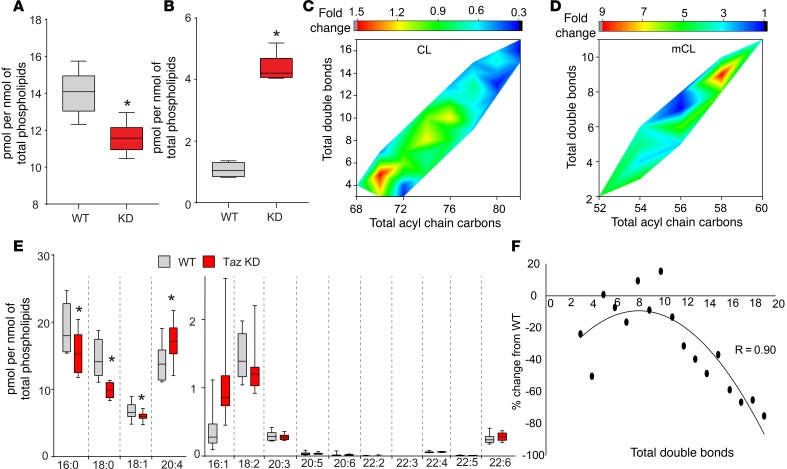
Figure 4. Changes in brain CL in Taz-KD mice.
(A) Quantitative assessment of total amount of CLs in the brains of WT and Taz-KD mice. n = 8/group and *P < 0.05 vs. WT, 2-tailed Student’s t test. The box plots depict the minimum and maximum values (whiskers), the upper and lower quartiles, and the median. The length of the box represents the interquartile range. (B) Total amount of mCLs in the brains of WT and Taz-KD mice. n = 8/group and *P < 0.05 vs. WT, 2-tailed Student’s t test. The box plots depict the minimum and maximum values (whiskers), the upper and lower quartiles, and the median. The length of the box represents the interquartile range. (C) Color contour map showing changes in CL in Taz-KD mouse brain compared with WT mouse brain. (D) Color contour map showing changes in mCL in Taz-KD mouse brain compared with WT mouse brain. Values are average from 8 animals. (E) Assessment of free fatty acid content in WT and Taz-KD mouse brain. n = 8/group and *P < 0.05 vs. WT, 2-tailed Student’s t test. The box plots depict the minimum and maximum values (whiskers), the upper and lower quartiles, and the median. The length of the box represents the interquartile range. (F) Correlation between changes in CL levels in Taz-KD mice (compared with WT) and the total number of double bonds. There was a strong correlation between these 2 parameters (R = 0.9). Values are average from 8 animals.

