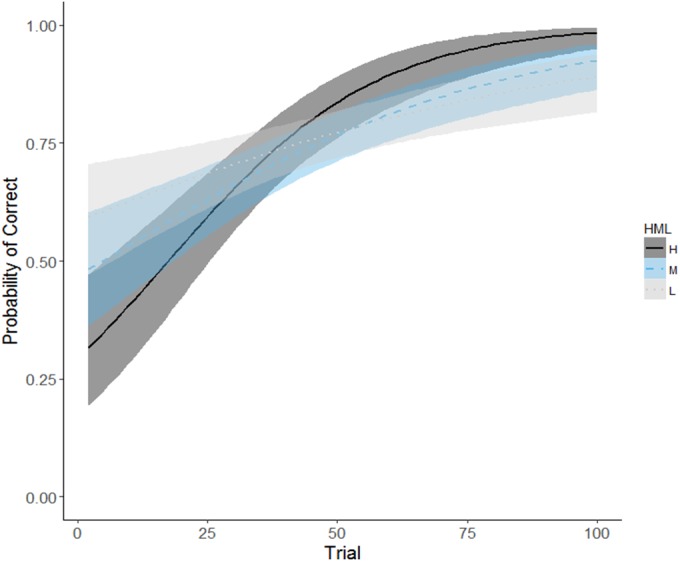
Figure 7. Predicted probability of choosing correctly on binary spatial discrimination task for adult male pheasants.

Curves predicted from a generalised linear model with social rank included as a factor with three levels, visualized in ggplot2 (Wickham, 2009). Boundaries for high, middle or low rank determined by splitting full range of mean Elo-ratings in to thirds for each cohort. Solid, dashed and dotted lines represent high (Cohort II: n = 2), middle (Cohort I: n = 1; Cohort II: n = 2) and lowest (Cohort I: n = 2; Cohort II: n = 1) ranking males, respectively.
