Abstract
Fiber-based polarization-sensitive optical coherence tomography (PS-OCT) that utilizes a rotationally-scanning catheter has a variety of potential biomedical applications in luminal organ systems due to its ability to provide intrinsic contrast for birefringent tissue. Incorporating the optic axis (OA) of the tissue greatly enhances this potential by also permitting information about the orientation of the tissue to be extracted; however, measurement distortion that occurs has up to this point made it impossible to obtain accurate sample OA measurements. In this paper we present a straightforward calibration technique that allows the sample OA to be recovered. This technique requires no hardware modifications making it generally applicable, and as a result has tremendous potential in improving the utility of endoscopic PS-OCT image data.
1. Introduction
Polarization-sensitive optical coherence tomography (PS-OCT) [1–3] is an extension of OCT [4] that can be used to detect the polarization properties of the imaging sample, including diattenuation [5,6], depolarization [7–9], and birefringence [3,10,11]. In biological tissue, sensitivity to birefringence is particularly relevant due to the form birefringence of numerous types of tissue, including collagen, elastin, and muscle. Due to the prevalence of these types of tissue a number of potential biomedical applications have been identified in a wide variety of organ systems, including the eye [12], skin [13], and luminal organ systems such as the cardiovascular system [14–16] and the lung [17,18]. Applications involving the eye or the skin can be tailored to using a free-space (“bulk”) imaging scheme [3,19], but many applications necessitate the use of a fiber optic catheter. The simplest and most common type of such a catheter involves a length of optical fiber with side viewing optics that is proximally connected to a rotary joint, allowing the catheter to spin independently of the rest of the system [20]. This configuration permits measurements of sample retardance, but the optic axis (OA) of the sample is distorted by the polarization effects of the system [2].
Access to the OA of the birefringent tissue could have significant applications in both differentiating and characterizing tissue, such as the in vivo assessment of airway smooth muscle in asthma [18]. In this work we describe a method for obtaining the OA of the imaging sample in endoscopic PS-OCT. This method requires no hardware modifications and imposes minimal computational load. Additionally, no pre-calibration procedure is required and as a result the technique can be applied retroactively to data already obtained.
In the following sections we outline the theory of both the problem and our proposed solution, and couple this with the results of simulations that demonstrate the impact of this theory on obtained data. We then present our experimental results, including our validation experiments in which we assess the accuracy and consistency of our calibration technique, as well as the outcome of applying our calibration to human airway data that was obtained in vivo. These experimental results illustrate both the validity and robustness of the technique itself, as well as the potential of the technique to impact future studies.
2. Measuring the OA of a birefringent sample in endoscopic PS-OCT
In the Stokes formalism [21] in which we operate for analyzing our PS-OCT data, the polarization state measured at the detectors of any implementation of a PS-OCT system is determined by the polarization effects of three distinct components on the input state: the optical path from source to sample (“system input”), the sample, and the path from sample to detector (“system output”). Mathematically, these components can be represented by a product of Mueller matrices:, where is the measured state, the input state, the system output matrix, and the system input matrix. The sample matrix is a function of the image depth z and has been further divided into the forward component and the reflected component, where the D subscript here and throughout the manuscript indicates the relationship, with [9]. From this point onward we make the following two assumptions: 1) that the system elements are pure retarders, and 2) that the sample can generally be treated as a series (in depth) of linear retarders. The former can be made a more realistic approximation by compensating for polarization mode dispersion (PMD) with the use of spectral binning [22], while the latter assumption is consistent with observation for many types of tissue [23].
Following these assumptions, all of the Mueller matrices involved are reduced to rotation matrices, and a reference measurement (typically the reflection from the sample’s surface) can then be used to obtain a similarity transformation of the sample matrix from which the sample retardance can be readily obtained [2]. The OA of the sample, however, is rotated by the unknown MB. This is further complicated when a rotating fiber optic imaging catheter is employed, causing a component of the system to be dependent on the angle of the catheter: , where is the Mueller matrix of the catheter as a function of its angular position. We note that here we are treating the sample as being uniform both azimuthally and in depth. The former we do only for simplicity and clarity in describing the theory. Sample inhomogeneity in depth, however, can introduce additional transformation factors that also need to be compensated for [24].
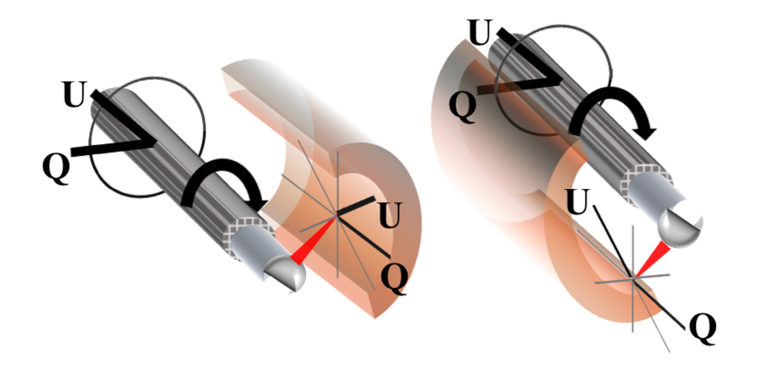
We now make a third assumption that can be decomposed such that, where represents the fiber rotation; i.e., that the fiber birefringence is constant along the rotation. This formulation imposes an active transformation of the sample along with the fiber optic catheter and in doing so maintains a consistent coordinate system along the circumference of the sample. This coordinate system is depicted in Fig. 1. The final modification that we make to our equation for the measured Stokes vector is to separate out the fixed component of the catheter sheath from the Mueller matrix of the sample:
| (1) |
| (2) |
We label the catheter sheath because for extruded polymer catheter sheaths the OA of the sheath is along the axis of extrusion [18]. Equation (1) then describes the full physical path of the polarized light from source to detector (for a given sample depth z and catheter position ), while Eq. (2) is the similarity transformation obtained by multiplying the measurement at sample depth z by the inverse of the measurement at the sample surface .
Fig. 1.
Depiction of the coordinate system at the sample surface, in Stokes space. This system results in rotational invariance for rotations in the plane perpendicular to the axis of the catheter.
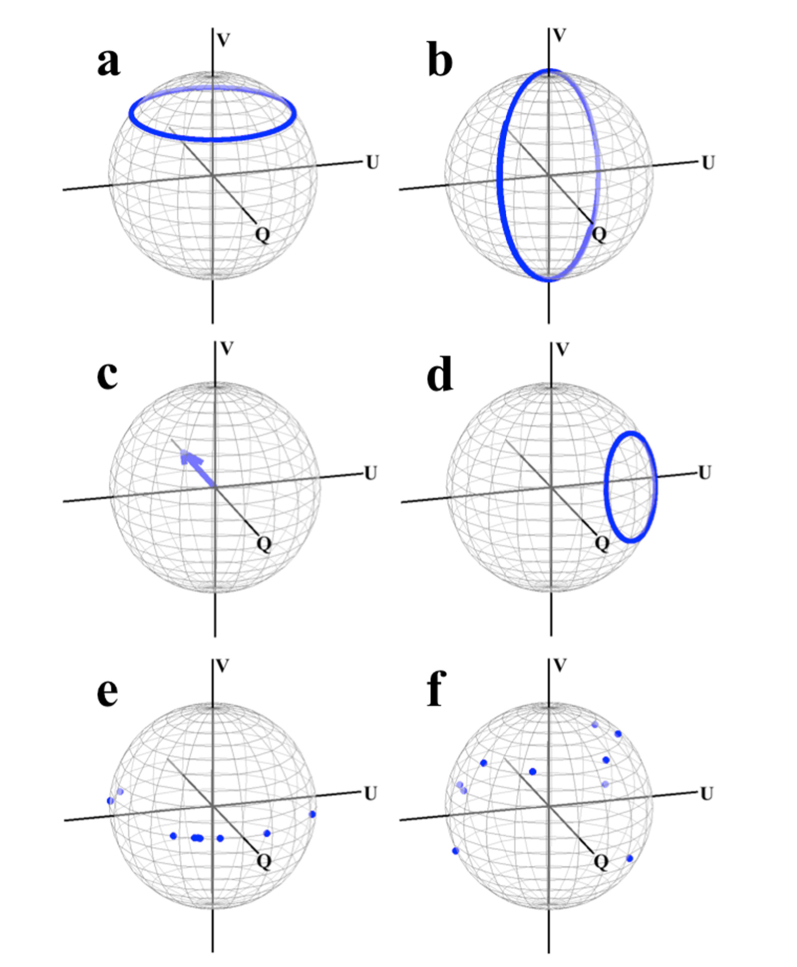
From Eq. (2) it is apparent that in order to solve for the OA of the sample at each angular position of the catheter it is first necessary to determine the product of the three rotation matrices,, and. Specifically, we wish to determine this product and apply it to Eq. (2) in order to resolve the physical OA in the local coordinate system of the sample, as depicted in Fig. 1. We note that while this coordinate system is not absolute in that it depends on the position of our catheter (in contrast with that of the “laboratory” coordinate system), it nevertheless would allow us to obtain the information we desire; that is, the intrinsic characteristic of the sample itself. We have performed simulations that demonstrate the compounding effects of these individual components on sample OA measurements, which we summarize in Fig. 2. This data was generated using randomized values for the retardance and OA of the individual system components included in Eq. (1), with the “measured” OA values obtained from the similarity transformation of the respective matrices. For example, the “measured” sheath OA [Fig. 2(d)] was calculated according to the product . These results highlight several key features of the effect of the preceding components on the ones that follow them: the axis of is rotated from the V = 0 plane by, the axis of rotates in a circle parallel to and offset in part by the magnitude of the fibers birefringence, and the planar (V = 0) sample value OAs become non-planar and have the appearance of being randomly scattered on the Poincare sphere.
Fig. 2.
Simulation data demonstrating the effect of the system on sample OA measurements. Each data point represents an angular position of the catheter fiber, with the range encompassing 0 to 2π. (a) Actual and (b) measured catheter OA. (c) Actual and (d) measured sheath OA. (e) actual and (f) measured sample OA. The randomly generated sample OA values are shifted from the Q-U plane to seemingly arbitrary locations on the full Poincare sphere.
3. Description of technique for obtaining the sample OA
As mentioned in Section 2, solving for the OA of the sample requires solving the product of the rotation matrices,, and in order to recover the coordinate system described in Fig. 1. We have previously demonstrated that we can measure using the inner and outer surfaces of the sheath in the image, which we know is oriented along the –Q direction in the coordinate system of the sample [18]. Any attempt to determine introduces two significant complications: 1) a priori knowledge of is limited and cannot be calibrated or fixed due to catheter dynamics, and 2) there is no reference point within the image range from which to obtain the similarity transformation of. We can partially overcome these difficulties by making the following observation:
| (3) |
| (4) |
| (5) |
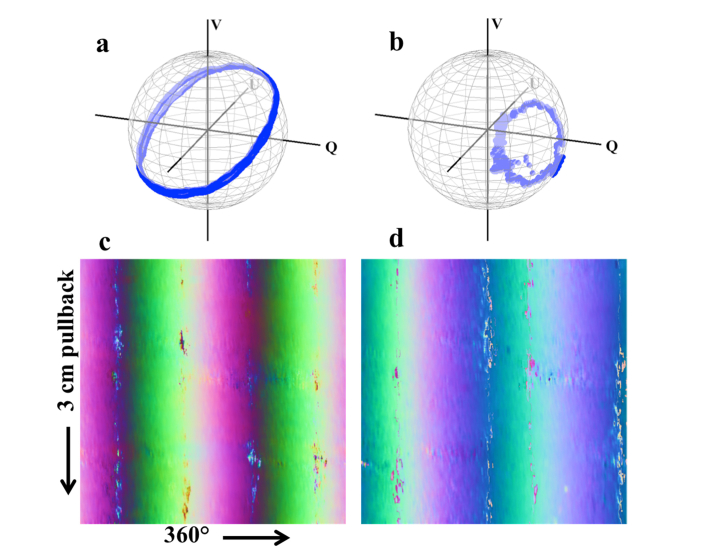
Where is the position of the catheter lens reflection (or, equivalently, the reflection from the inner surface of the catheter sheath). That is to say, the catheter’s position at produces a rotation matrix that is the transpose of the one at , and that using this information we can extract the similarity transformation of the catheter without a prior reference point. The catheter matrix that we obtain with this method necessarily has any circular birefringence component negated due to the presence of both andterms; however, any such component is constant with and can be absorbed into a solution forwithout impacting the calibration. We denote this modification by . Our experimental data closely match simulations for both catheter and sheath, even in data obtained during endoscopic PS-OCT imaging conducted in human volunteers [Fig. 3(a,b)]. Furthermore, the stability of this data over the course of volumetric imaging [Fig. 3(c,d)] permits averaging that may be used to mitigate the impact of signal noise.
Fig. 3.
Experimental results for catheter and sheath OA measurements. (a) Catheter and (b) sheath measurements over one rotation. (c) Catheter and (d) sheath measurements from a 3 cm pullback performed in vivo, with the OA values shifted and scaled to the range of [0,1] and depicted in true RGB (where the Q component is mapped to the R channel, and the U and V components the G and B channels, respectively). These images demonstrate the consistency of these measurements even during in vivo imaging.
The measurements we are now able to make provide us with equations in the following forms:
| (6) |
| (7) |
| (8) |
Where are the sample matrices to be recovered, the meas subscript indicates the matrices we measure, and the primed matrices denote that any circular birefringence component has been absorbed from into. Solving for the transformation is now a straightforward problem requiring the following steps:
-
1)
Find the rotation that rotates the axes of to the Q-U plane with the same rotation direction as that of the physical rotation of the catheter. This gives the magnitude of the rotation about one of the axes of in the Q-U plane, which we denote.
-
2)
Apply the rotation to to obtain. The product is equivalent to the product less an as yet undetermined rotation about the V axis.
-
3)
Rotate the axes of by the product. The single rotation about the V axis that now rotates the modifiedto Q = −1 provides the missing componentwith which.
In practice, polarimetry noise prevents all the measured OA values offrom aligning perfectly to a single axis. To compensate for this, the final rotationis determined from which rotation aligns the mean vector to Q = −1. Alternatively, additional filtering and/or interpolation may be performed in order to yield more consistent results in cases where the signal from the ball lens or the sheath is not well-defined. Once applied, this method offers a significant advantage over our previously published work in that it allows us to recover unambiguously the orientation of all linear OA values of our sample, and not just those limited to the Q-axis as we previously reported [18].
4. Experimental results
The experimental data presented here was obtained using a swept-source PS-OCT system with an electro-optic modulator for input polarization diversity. This is a standard system configuration which we have previously described [18]. Imaging was conducted using a number of different catheters with either ball lens or GRIN lens distal optics. No differences were observed in the performance of our calibration technique using the different catheters. To mitigate the effect of polarimetry noise the Stokes data that was used for calibrating the sample OA was filtered along the azimuthal direction using a Gaussian filter with an angular width of 4.2° at 1 standard deviation. The sample data was acquired from Stokes data filtered as above and using a depth offset of 20 µm for the differential birefringence calculations [6]. All data processing was performed using Matlab 2015a.
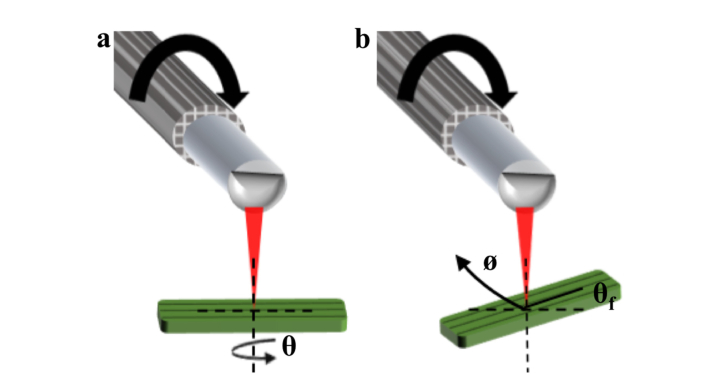
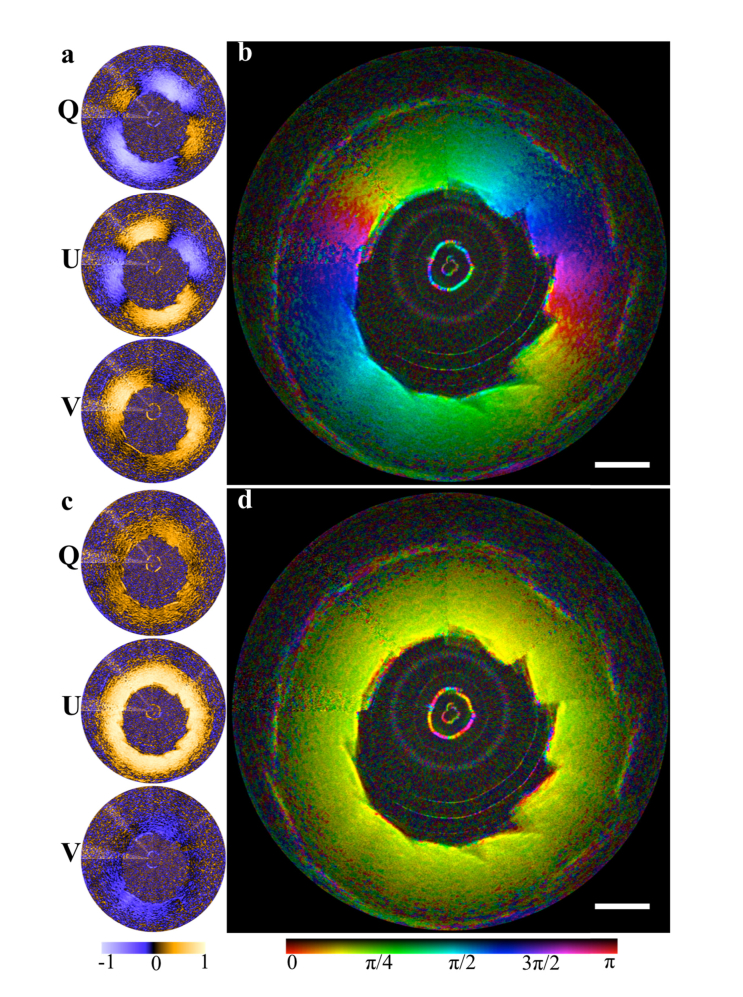
In order to first determine the accuracy of our calibration algorithm, we performed imaging using a birefringent rubber phantom. The rubber phantom, when stretched, exhibits a high degree of OA uniformity along its stretched axis [18]. It is therefore a useful alternative to imaging a waveplate, and is a closer analog to the imaging of biological tissue. We imaged the phantom using two different approaches in order to investigate the accuracy and consistency of our calibrations: first, the phantom was imaged at a fixed position with respect to the catheter, and rotated about its axis from 0 to 180° in 10° increments [Fig. 4(a)]. In the second approach, the phantom was maintained at a fixed orientation (with its stretched axis at 36° with respect to the long axis of the catheter) and rotated around the catheter during imaging over one complete rotation [Fig. 4(b)]. The results of these two experiments are depicted in Fig. 5 and Fig. 6, respectively. The latter experiment allowed us to ascertain the consistency with which a given orientation is measured at each angular position of the catheter. In both experiments the PS-OCT system and catheter were operated using the same parameters we apply to our in vivo imaging (with the probe rotating approximately 33 times per second) and with no special handling or arrangement that would preclude translating this technique to an in vivo setting.
Fig. 4.
Experimental configurations for rubber phantom imaging. (a) Configuration in which the phantom is rotated about its axis and the angle is measured. (b) Configuration in which the orientation of the phantom in the imaging plane is fixed as indicated by , and maintained at this angle as the entire phantom is rotated around the catheter ().
Fig. 5.
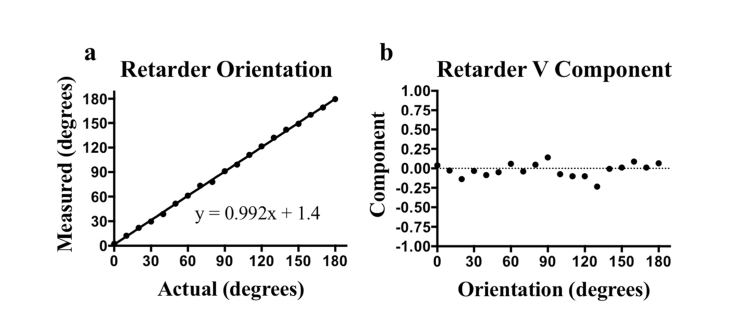
Experimental results obtained by rotating a phantom from 0 to 180° in 10° increments. (a) Measured versus actual orientation and (b) measured V component. The mean absolute error for the orientation was 1.4° and the mean V component was −0.02.
Fig. 6.
Rotation of the phantom (at 36° fixed orientation) 360° around the catheter. (a) The individual, uncorrected Stokes parameters. (b) The uncorrected angle data combined with the structural image. (c) The Stokes parameters and (d) angle data post-correction. The mean measured angle was 36.7° (S.D 2.64°) and the mean V component was −0.1 (S.D 0.118). Scale bar, 1 mm.
The combination of these two experiments allows us to quantify both the accuracy and consistency of our calibrations. The results of these data demonstrate that the V component of the sample OA is minimized following the calibrations, as expected. The angular measurements for the OA orientation were then obtained in the Q-U plane. A small region within the phantom encompassing approximately 3 speckles was averaged to produce each data point, with no out of frame averaging performed. From these experiments we determined that with our calibration technique we can measure the OA orientation both accurately (mean absolute error: 1.4°) and consistently over the full rotation of the catheter (S.D: 2.64°).
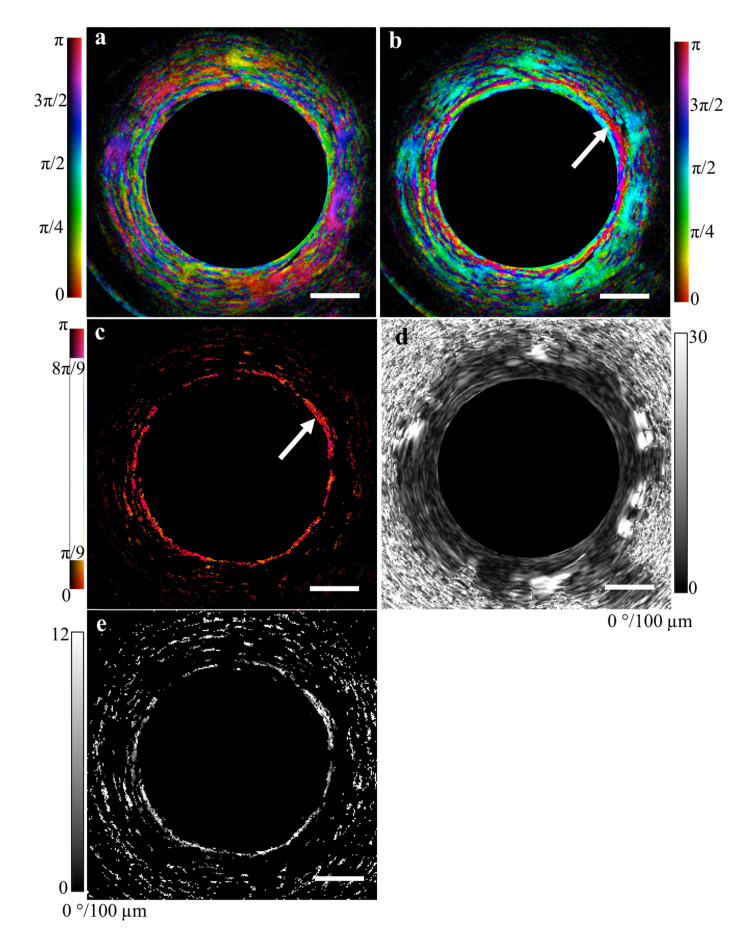
To verify that our method can be applied in data acquired in a clinical setting, we retroactively applied the technique to data that was acquired of human airways in vivo during bronchoscopy. These data sets were obtained over a period of years and with a variety of catheters. The airway wall is both useful for demonstrating the OA calibration and an important biological application of the technique. The elasticity and the need for caliber regulation of the airway wall means it is comprised of a number of birefringent tissues, with varying orientations. This includes the longitudinally oriented fiber bundle network in the submucosa [25] and the circumferentially-oriented airway smooth muscle, which wraps around the airway wall at angles up to 20° [26].
Figure 7 demonstrates the results of applying the technique to an airway. The OA image [Fig. 7(a,b)] is depicted in HSV format with the OA data encoded in the hue, the structural image the value, and constant saturation. By isolating a +/− 20° range within the corrected OA image we can easily identify the circumferentially-oriented airway smooth muscle [Fig. 7(c)]. In contrast, the retardance image alone [Fig. 7(d)] highlights the increase in information that is obtained by analyzing the OA data: the retardance of the airway wall layers is both weak and homogeneous, and as a result it is difficult to obtain any new information by analyzing the retardance alone. However, by masking the retardance image with the ASM image in Fig. 7(c), we can further isolate the retardance associated with the ASM band [Fig. 7(e)]. This data can then be further analyzed to assess muscle tone, which is relevant to certain diseases and disorders of the airway [18].
Fig. 7.
OA correction technique applied to a cross-sectional image of an airway acquired in vivo from a healthy human volunteer. (a) Uncorrected and (b) corrected OA images combined with the structural image. The range of corrected values can be restricted to identify the airway smooth muscle (white arrow) (b). Using this result as a mask we can extract from the retardance image (c) the retardance associated with the muscle alone (d). Scale bars, 500 µm.
5. Conclusion
In conclusion, we have developed a calibration technique for obtaining the sample OA in endoscopic PS-OCT data sets. This technique is computationally efficient, robust, and does not require any pre-calibration procedures or hardware modifications. Using a uniform retarder we have demonstrated that this technique provides both accuracy and consistency in measuring the OA direction along the full rotation of the endoscopic catheter. We have retroactively applied this calibration technique to in vivo endoscopic imaging data sets and have verified that the calibration approach is viable in the clinical setting. We anticipate that this technique may be of significant use in differentiating and characterizing tissue across multiple organ systems and applications.
Funding
National Institutes of Health (NIH) (R01HL133664; R01CA167827).
6. References and links
- 1.Hee M. R., Huang D., Swanson E. A., Fujimoto J. G., “Polarization-sensitive low-coherence reflectometer for birefringence characterization and ranging,” J. Opt. Soc. Am. B, JOSAB 9(6), 903–908 (1992). 10.1364/JOSAB.9.000903 [DOI] [Google Scholar]
- 2.Park B., Pierce M., Cense B., de Boer J., “Real-time multi-functional optical coherence tomography,” Opt. Express 11(7), 782–793 (2003). 10.1364/OE.11.000782 [DOI] [PubMed] [Google Scholar]
- 3.Hitzenberger C., Goetzinger E., Sticker M., Pircher M., Fercher A., “Measurement and imaging of birefringence and optic axis orientation by phase resolved polarization sensitive optical coherence tomography,” Opt. Express 9(13), 780–790 (2001). 10.1364/OE.9.000780 [DOI] [PubMed] [Google Scholar]
- 4.Huang D., Swanson E. A., Lin C. P., Schuman J. S., Stinson W. G., Chang W., Hee M. R., Flotte T., Gregory K., Puliafito C. A., Et A., “Optical coherence tomography,” Science 254(5035), 1178–1181 (1991). 10.1126/science.1957169 [DOI] [PMC free article] [PubMed] [Google Scholar]
- 5.Kemp N., Zaatari H., Park J., Rylander Iii H. G., Milner T., “Form-biattenuance in fibrous tissues measured with polarization-sensitive optical coherence tomography (PS-OCT),” Opt. Express 13(12), 4611–4628 (2005). 10.1364/OPEX.13.004611 [DOI] [PubMed] [Google Scholar]
- 6.Todorović M., Jiao S., Wang L. V., Stoica G., “Determination of local polarization properties of biological samples in the presence of diattenuation by use of Mueller optical coherence tomography,” Opt. Lett. 29(20), 2402–2404 (2004). 10.1364/OL.29.002402 [DOI] [PubMed] [Google Scholar]
- 7.Schmitt J. M., Xiang S. H., “Cross-polarized backscatter in optical coherence tomography of biological tissue,” Opt. Lett. 23(13), 1060–1062 (1998). 10.1364/OL.23.001060 [DOI] [PubMed] [Google Scholar]
- 8.Baumann B., Baumann S. O., Konegger T., Pircher M., Götzinger E., Schlanitz F., Schütze C., Sattmann H., Litschauer M., Schmidt-Erfurth U., Hitzenberger C. K., “Polarization sensitive optical coherence tomography of melanin provides intrinsic contrast based on depolarization,” Biomed. Opt. Express 3(7), 1670–1683 (2012). 10.1364/BOE.3.001670 [DOI] [PMC free article] [PubMed] [Google Scholar]
- 9.Lippok N., Villiger M., Bouma B. E., “Degree of polarization (uniformity) and depolarization index: unambiguous depolarization contrast for optical coherence tomography,” Opt. Lett. 40(17), 3954–3957 (2015). 10.1364/OL.40.003954 [DOI] [PMC free article] [PubMed] [Google Scholar]
- 10.Kemp N. J., Park J., Zaatari H. N., Rylander H. G., Milner T. E., “High-sensitivity determination of birefringence in turbid media with enhanced polarization-sensitive optical coherence tomography,” J. Opt. Soc. Am. A 22(3), 552–560 (2005). 10.1364/JOSAA.22.000552 [DOI] [PubMed] [Google Scholar]
- 11.Park B. H., Pierce M. C., Cense B., de Boer J. F., “Optic axis determination accuracy for fiber-based polarization-sensitive optical coherence tomography,” Opt. Lett. 30(19), 2587–2589 (2005). 10.1364/OL.30.002587 [DOI] [PubMed] [Google Scholar]
- 12.Zotter S., Pircher M., Torzicky T., Baumann B., Yoshida H., Hirose F., Roberts P., Ritter M., Schütze C., Götzinger E., Trasischker W., Vass C., Schmidt-Erfurth U., Hitzenberger C. K., “Large-field high-speed polarization sensitive spectral domain OCT and its applications in ophthalmology,” Biomed. Opt. Express 3(11), 2720–2732 (2012). 10.1364/BOE.3.002720 [DOI] [PMC free article] [PubMed] [Google Scholar]
- 13.Pierce M. C., Strasswimmer J., Park B. H., Cense B., de Boer J. F., “Advances in optical coherence tomography imaging for dermatology,” J. Invest. Dermatol. 123(3), 458–463 (2004). 10.1111/j.0022-202X.2004.23404.x [DOI] [PubMed] [Google Scholar]
- 14.Nadkarni S. K., Pierce M. C., Park B. H., de Boer J. F., Whittaker P., Bouma B. E., Bressner J. E., Halpern E., Houser S. L., Tearney G. J., “Measurement of collagen and smooth muscle cell content in atherosclerotic plaques using polarization-sensitive optical coherence tomography,” J. Am. Coll. Cardiol. 49(13), 1474–1481 (2007). 10.1016/j.jacc.2006.11.040 [DOI] [PMC free article] [PubMed] [Google Scholar]
- 15.van der Sijde J. N., Karanasos A., Villiger M., Bouma B. E., Regar E., “First-in-man assessment of plaque rupture by polarization-sensitive optical frequency domain imaging in vivo,” Eur. Heart J. 37(24), 1932 (2016). 10.1093/eurheartj/ehw179 [DOI] [PMC free article] [PubMed] [Google Scholar]
- 16.Fu X., Wang Z., Wang H., Wang Y. T., Jenkins M. W., Rollins A. M., “Fiber-optic catheter-based polarization-sensitive OCT for radio-frequency ablation monitoring,” Opt. Lett. 39(17), 5066–5069 (2014). 10.1364/OL.39.005066 [DOI] [PMC free article] [PubMed] [Google Scholar]
- 17.Hariri L. P., Villiger M., Applegate M. B., Mino-Kenudson M., Mark E. J., Bouma B. E., Suter M. J., “Seeing beyond the bronchoscope to increase the diagnostic yield of bronchoscopic biopsy,” Am. J. Respir. Crit. Care Med. 187(2), 125–129 (2013). 10.1164/rccm.201208-1483OE [DOI] [PMC free article] [PubMed] [Google Scholar]
- 18.Adams D. C., Hariri L. P., Miller A. J., Wang Y., Cho J. L., Villiger M., Holz J. A., Szabari M. V., Hamilos D. L., Scott Harris R., Griffith J. W., Bouma B. E., Luster A. D., Medoff B. D., Suter M. J., “Birefringence microscopy platform for assessing airway smooth muscle structure and function in vivo,” Sci. Transl. Med. 8(359), 359 (2016). 10.1126/scitranslmed.aag1424 [DOI] [PMC free article] [PubMed] [Google Scholar]
- 19.Park B. H., Pierce M. C., Cense B., de Boer J. F., “Jones matrix analysis for a polarization-sensitive optical coherence tomography system using fiber-optic components,” Opt. Lett. 29(21), 2512–2514 (2004). 10.1364/OL.29.002512 [DOI] [PMC free article] [PubMed] [Google Scholar]
- 20.Tearney G. J., Brezinski M. E., Bouma B. E., Boppart S. A., Pitris C., Southern J. F., Fujimoto J. G., “In Vivo Endoscopic Optical Biopsy with Optical Coherence Tomography,” Science 276(5321), 2037–2039 (1997). 10.1126/science.276.5321.2037 [DOI] [PubMed] [Google Scholar]
- 21.de Boer J. F., Milner T. E., “Review of polarization sensitive optical coherence tomography and Stokes vector determination,” J. Biomed. Opt. 7(3), 359–371 (2002). 10.1117/1.1483879 [DOI] [PubMed] [Google Scholar]
- 22.Villiger M., Zhang E. Z., Nadkarni S. K., Oh W.-Y., Vakoc B. J., Bouma B. E., “Spectral binning for mitigation of polarization mode dispersion artifacts in catheter-based optical frequency domain imaging,” Opt. Express 21(14), 16353–16369 (2013). 10.1364/OE.21.016353 [DOI] [PMC free article] [PubMed] [Google Scholar]
- 23.de Boer J. F., Milner T. E., Nelson J. S., “Determination of the depth-resolved Stokes parameters of light backscattered from turbid media by use of polarization-sensitive optical coherence tomography,” Opt. Lett. 24(5), 300–302 (1999). 10.1364/OL.24.000300 [DOI] [PubMed] [Google Scholar]
- 24.Fan C., Yao G., “Mapping local optical axis in birefringent samples using polarization-sensitive optical coherence tomography,” J. Biomed. Opt. 17(11), 110501 (2012). 10.1117/1.JBO.17.11.110501 [DOI] [PubMed] [Google Scholar]
- 25.Carroll N. G., Perry S., Karkhanis A., Harji S., Butt J., James A. L., Green F. H. Y., “The airway longitudinal elastic fiber network and mucosal folding in patients with asthma,” Am. J. Respir. Crit. Care Med. 161(1), 244–248 (2000). 10.1164/ajrccm.161.1.9805005 [DOI] [PubMed] [Google Scholar]
- 26.Lei M., Ghezzo H., Chen M. F., Eidelman D. H., “Airway smooth muscle orientation in intraparenchymal airways,” J. Appl. Physiol. 82(1), 70–77 (1997). 10.1152/jappl.1997.82.1.70 [DOI] [PubMed] [Google Scholar]


