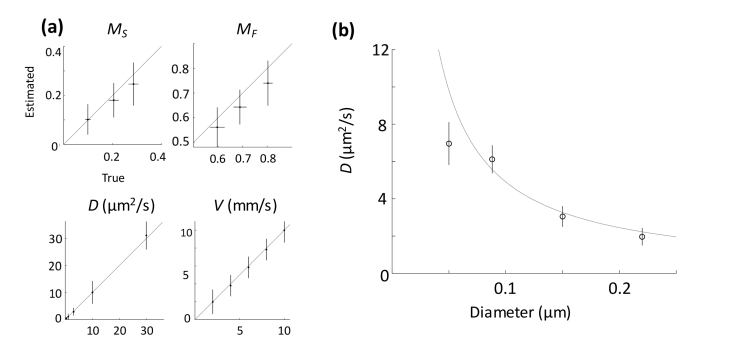
Fig. 3.
(a) Numerical simulation results with the optimized acquisition time and maximum time lag. Each error bar represents variations due to the other combinations: diffusion coefficients, flow velocities, flow angles, and/or number densities. (b) DLS-OCM measurements of the diffusion coefficient in the standard sample. The circles with error bars indicate measurement data while the line indicates the theoretical value as given by the Stokes-Einstein equation.

