Fig. 7.
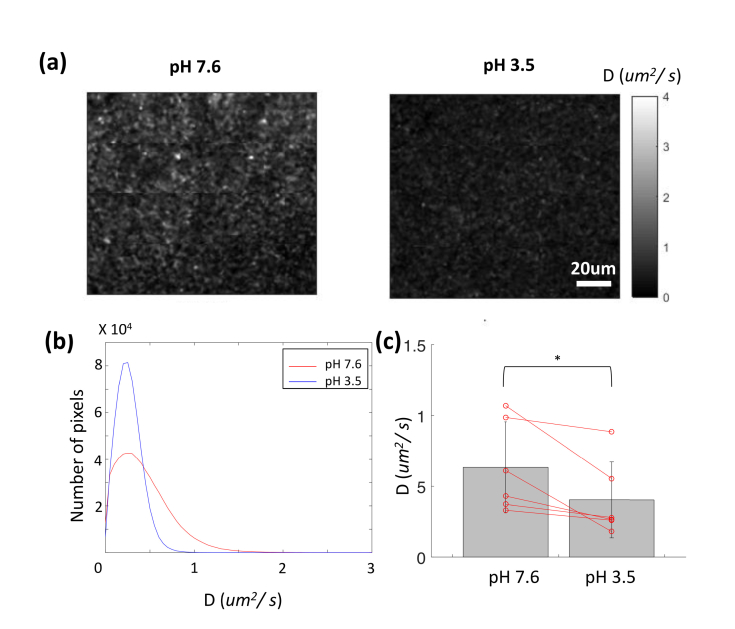
ICM measurements under pH change. (a) Diffusion coefficient maps at pH 7.6 and 3.5. The presented en face maps were obtained by maximum intensity projection of five en face slices around the focal depth (corresponding to a 17.3-μm depth). Scale bar: 20um. (b) Histograms of the diffusion coefficient at the two pH conditions. (c) Statistical analysis of ICM changes (n = 5). Red lines indicate changes in the individual averages. The p-values were obtained by the paired student t-test. * denotes p < 0.05.

