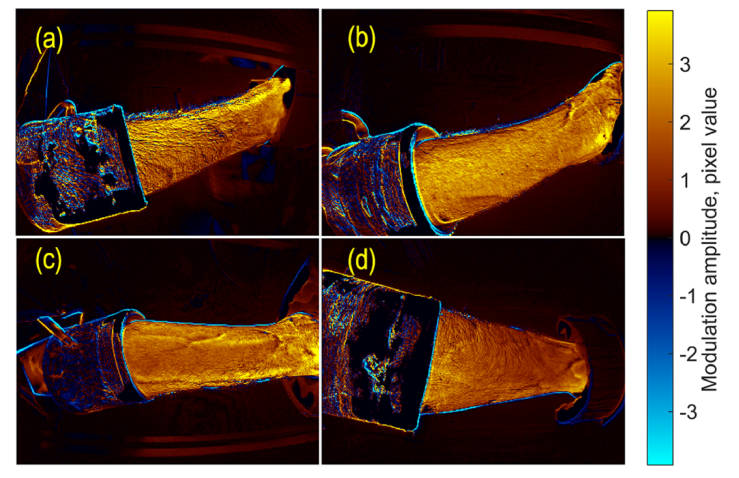
Fig. 5.
Spatial distribution of the amplitude of the light intensity variations in time corresponding to the first PC. The radial, ulnar, palmar, and dorsal sides of the forearm are shown in panels (a), (b), (c), and (d), respectively. The color scale on the right shows the amplitude in pixel values. Red-yellow colors are associated with the positive sign for in-phase modulations with the first PC, whereas blue-cyan colors represent the negative sign or counter-phase modulation.

