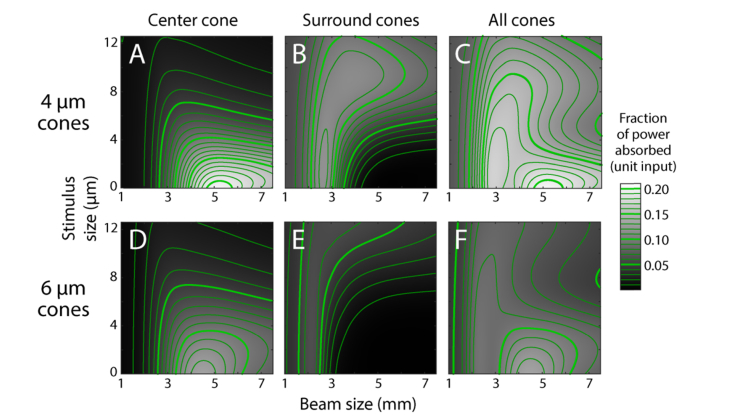
Fig. 5.
Power absorbed by cones for d0 = 4 μm (A-C) and 6 μm (D-F) using a square stimulus. Absorption is based on the initial field having unit power. Grayscale values are interpolated (bicubic) from data computed at intervals of 0.25 mm for beam size and 0.9 μm for stimulus size. Absorbed power contours are in steps of 0.01 (thin lines) and 0.05 (thick lines).

