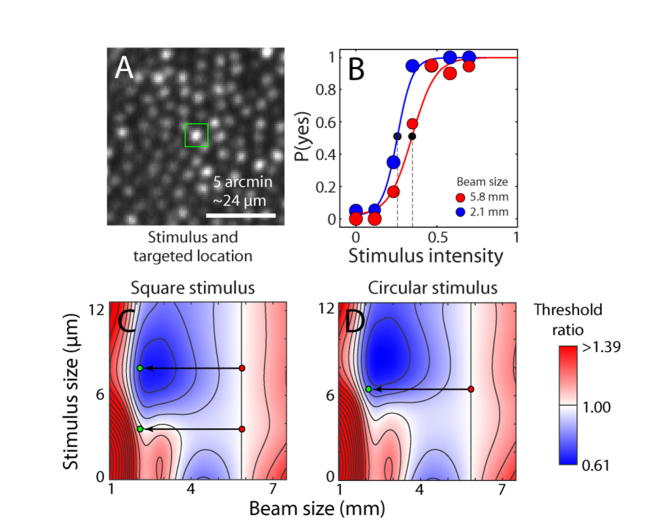
Fig. 8.
Effect of beam and stimulus size on light capture. (A) Retinal site tested for increment thresholds with 7.92 μm stimulus outlined over targeted cone at 3° eccentricity in Subject 1. (B) Psychometric data and fits for two different beam sizes. Threshold is defined at the power level yielding a 0.5 probability of detection (dashed lines). Data points are scaled to the number of successfully delivered trials at each intensity (out of 20). (C) Map of predicted change in threshold ratio from a 5.85 mm pupil for a square stimulus. Superimposed on the map are the experiment conditions illustrated as red→green dot pairs, representing a shift from large to small beam sizes. The top red-green pair is for the cone tested in panels A-B. (D) Data as in C, but with a circular stimulus. Color coded threshold ratios are interpolated (bicubic) from data computed at intervals of 0.2 mm for pupil size and 0.9 μm for stimulus size. Stimulus size is the edge length of a square or diameter of a circle. Contours have steps of 0.01 normalized units.

