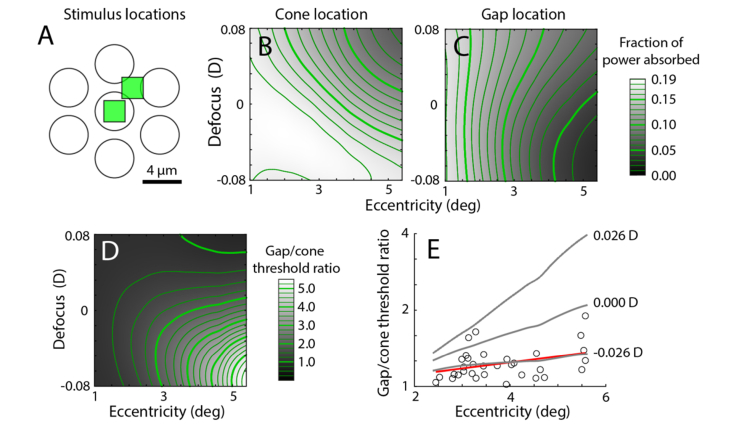
Fig. 9.
Gap/cone threshold ratio model of light absorption. (A) Schematic of stimulus conditions from [24], with light either targeted on a cone or in a gap. (B) Modeled fraction of light absorbed when a 3 × 3 pixel stimulus is centered on a cone at varying eccentricities and defocus. (C) As in B, when the same stimulus is placed in a gap between cones. (D) Gap/cone threshold ratio as a function of eccentricity and defocus. (E) Comparison of modeled versus observed ratios (circles from Fig. 5(C) in [24], red line shows linear fit). Threshold ratios for different defocus values (gray lines) showed that the best fit occurred at −0.026 D.

