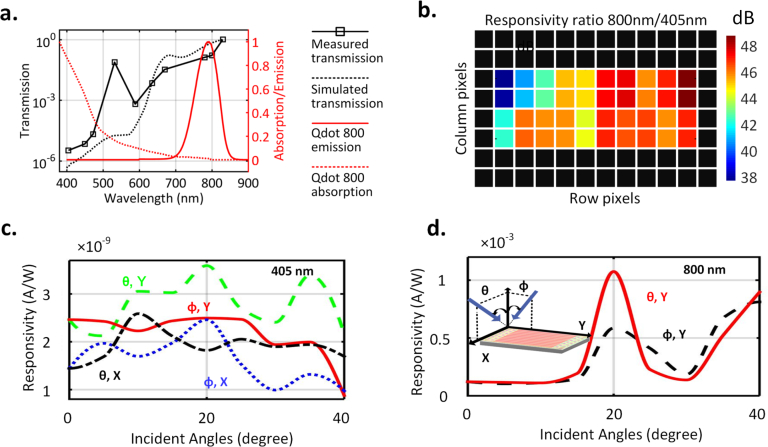
Fig. 5.
a. Measured (and simulated) transmission spectrum (normalized) showing ∼ 47 dB rejection ratio between 800 nm and 405 nm wavelengths. The absorption and emission spectrum of the chosen quantum dot fluorophore (Qdot 800) are shown inside the figure. b. Measured filtering ratio (in dB) for emission and fluorescence shows an average ratio of 45 dB for the center 40 pixels. c,d. Measured transmission at excitation and fluorescence wavelengths with varying incident angles and polarizations. e. Using on-chip decoders to address the sensor array and read out multiple pixels within single integration (200 ms). f. Measured sensitivity shows capability of detection of fluorescence signals, 77 dB below the excitation.

