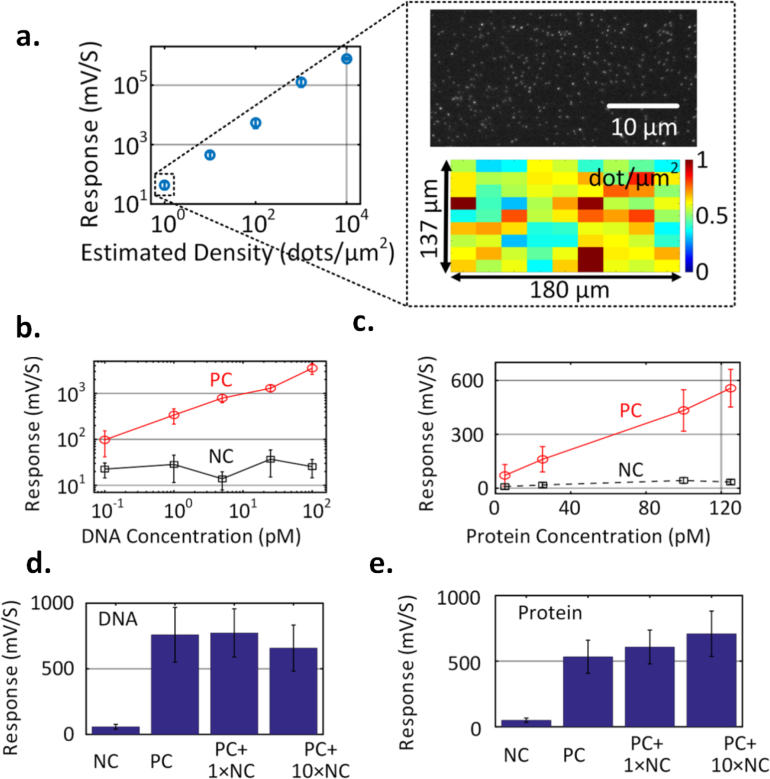
Fig. 7.
Measured sensor response versus surface density of QD 800 fluorophore demonstrating sensitivity level below 1 dot/μm2. The inset figure shows the distribution of surface densities captured in a fluorescence microscopy set-up corroborating with the average surface density. c,d. Measured sensor response against target volume concentration in DNA and protein (IL-6) assays, demonstrating volume sensitivity level down to 100 fM for DNA and 5 pM for protein. e,f. Measured effects of non-specific binding for target volume concentrations of 10 pM for DNA and 100 pM for IL-6.

