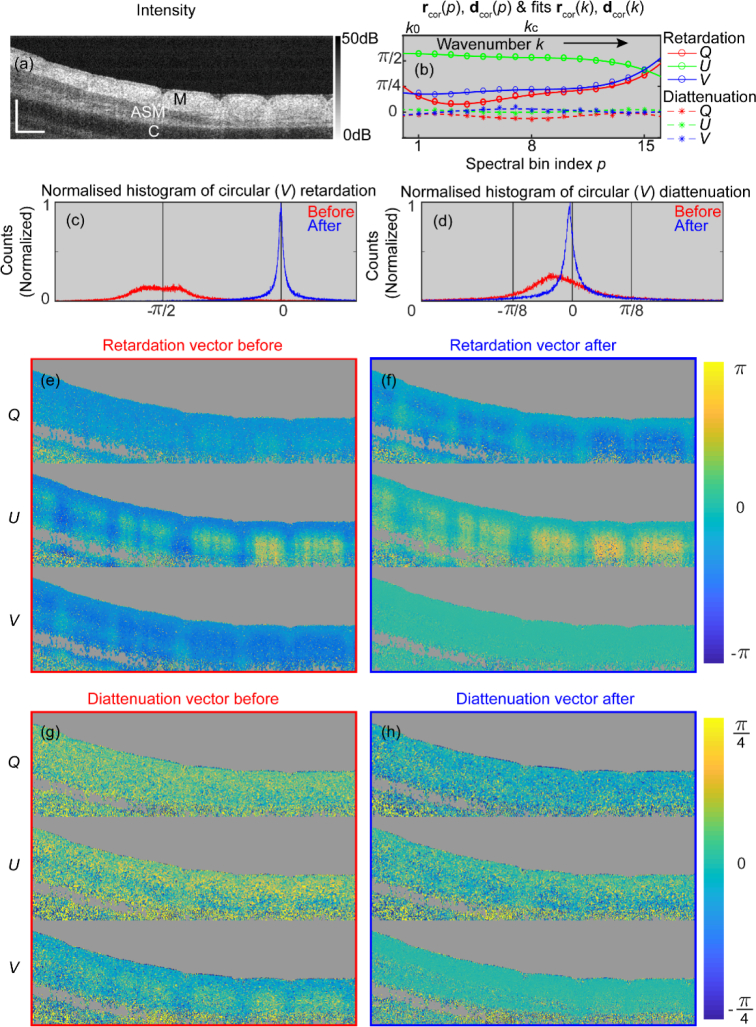
Fig. 1.
Example of symmetrization of full Jones matrix with an ex-vivo lamb trachea sample. (a) Cross-sectional intensity image of the sample. M: Mucosa; ASM: Airway smooth muscle; C: Cartilage. (b) Plots of retardation vectors rcor(p) (circles) and diattenuation vectors dcor(p) (stars) of Jcor(p) and their 3rd order polynomial fits rcor(k) (solid lines) and dcor(k) (dashed lines) across the full spectrum. kc is the central wavenumber. Normalized histogram of the circular (V) component of the retardation vectors (c) and diattenuation vectors (d) of the full Jones matrix before (red, Jtom(z)) and after (blue, ) symmetrization. Images of the retardation vectors of the full Jones matrix before (e) and after symmetrization (f). Images of the diattenuation vectors of the full Jones matrix before (g) and after symmetrization (h). Scale bar: 500 μm (physical length assuming refractive index of 1.40 of biological samples here and throughout this manuscript).

