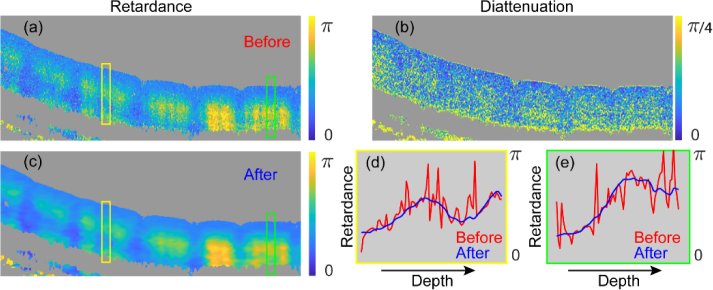
Fig. 3.
Generation and spatial filtering of cumulative SO(3). Image of cumulative retardance (a) and (b) diattenuation of the sample decomposed from the general Jones matrix. (c) Image of retardance of SO(3) after spatial averaging. (d) Retardance of the central A-line in the yellow box in (a) before (red) and in (b) after spatial averaging (blue). (e) Retardance of the central A-line in the green box in (a) before (red) and in (b) after spatial averaging (blue).

