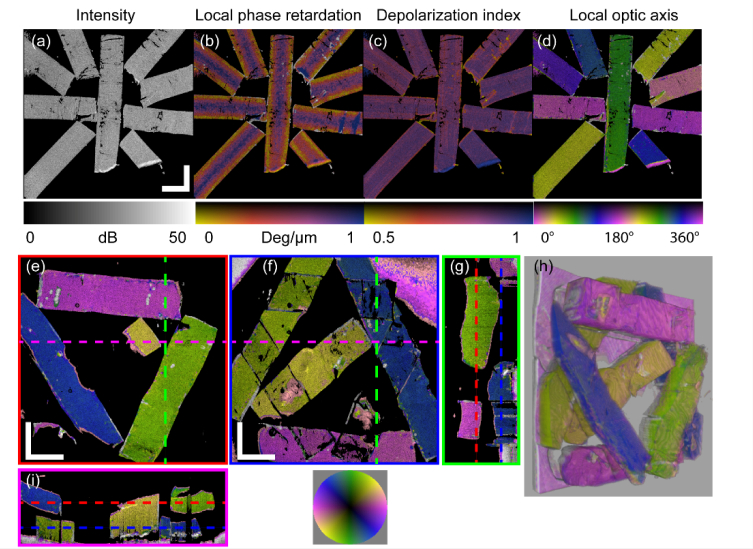
Fig. 4.
Validation with custom-made birefringence phantoms (Phantom #1 for (a-d), Phantom #2 for (e-i)). En face view of (a) OCT intensity image. Overlays on intensity image, respectively, of: (b) local phase retardation; (c) depolarization index; and (d) local optic axis orientation. (e) & (f) En face views of the local optic axis orientation of the top layer (e) and the bottom layer (f), corresponding to sections indicated by the red and blue dashed lines in (g) and (i), respectively. (g) Cross-sectional view through the green dashed line in (e) and (f). The white region in the upper left corner and the pink region in the upper right corner of (f) show the adhesive tape that fixes the phantom. (h) A frame from a 3D rendering (available online: Visualization 1 (600.3KB, mp4) ) of the local optic axis orientation of Phantom #2. (i) Cross-sectional view through the pink dashed line in (e) and (f). Scale bars: 2 mm (physical length).

