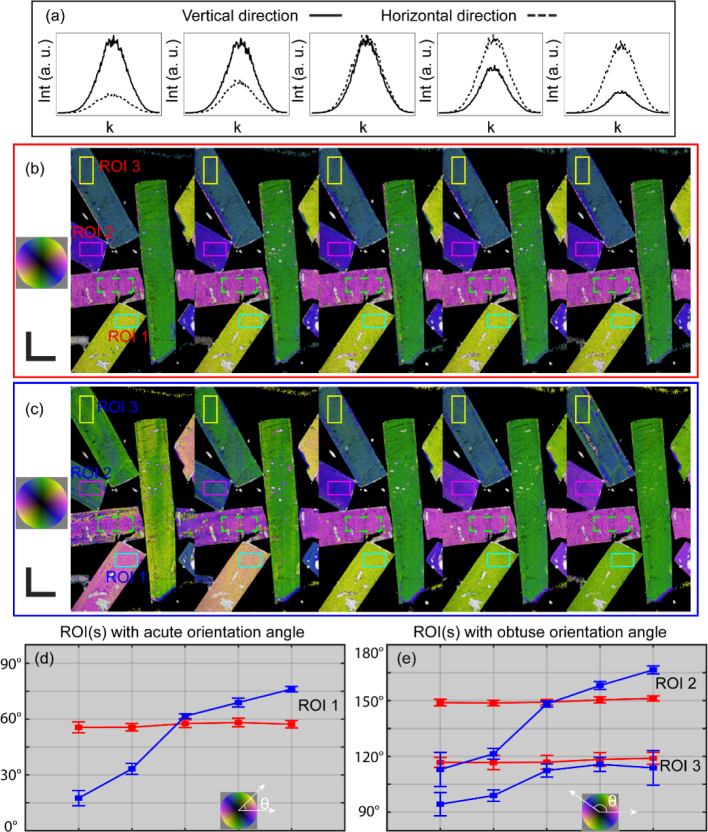
Fig. 5.
Local optic axis orientations with different system distortions. (a) The intensity of the reference signal in vertical (solid) and horizontal (dash) directions in different measurements. The optic axis orientation overlaid on the intensity images, processed, respectively, with the method in this manuscript (b) and the method in Villiger et al. [25] (c), where the OA orientations of the dashed green boxes are offset to match with their physical orientation. Plots of mean value and standard deviation of the acute (d) and obtuse (e) absolute optic axis orientation in ROIs of (b, red) and (c, blue). Scale bars: 1 mm (physical length).

