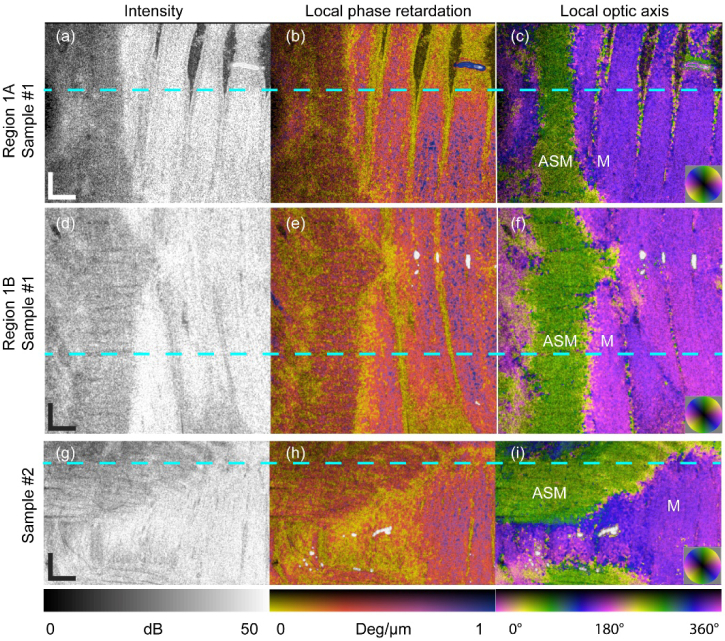
Fig. 7.
En face views of lamb trachea samples measured ex vivo. OCT intensity, local phase retardation and local optic axis for: Regions 1A (a-c) and 1B (d-f) of Sample #1 and Sample #2 (g-i), corresponding to the layers indicated by the dashed yellow lines in Fig. 6, respectively. The dashed cyan lines indicate the locations of the B-scan in Fig. 6. The localized blue region in (b) and small white regions in (e) and (h) are artifacts due to strong reflections from the sample surface. M: Mucosa; ASM: Airway smooth muscle. (Video clips available online: Visualization 5 (6.5MB, mp4) , Visualization 6 (7.5MB, mp4) , and Visualization 7 (5.3MB, mp4) ). Scale bar: 500 μm (physical length).

