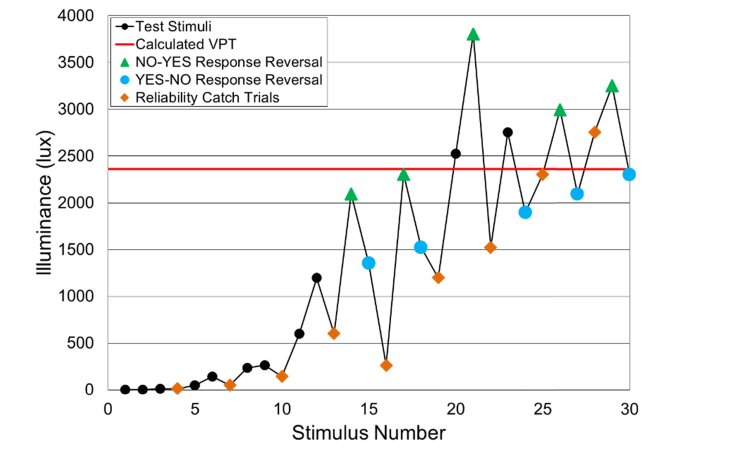
Fig. 4.
Example of a response curve. The software automatically assesses the subject’s visual photosensitivity threshold from the mean of 10 response reversals (For clarity, the green triangles and blue points have been added to delineate between response reversals and the orange diamonds represent catch trials).

