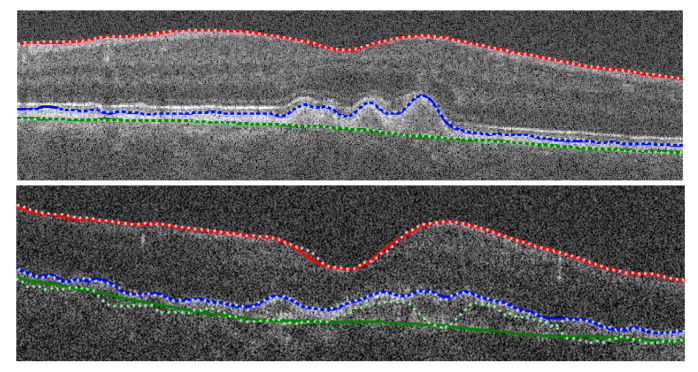
Fig. 5.
Example RNN-GS segmentation plots of two different participants from data set 2 (AMD OCT images) with the locations of the true (solid lines) and predicted (dotted lines) boundaries marked. The top image shows close agreement between the predictions and truths while the bottom image shows an example of a failure case for the BM boundary with a relatively high level of disagreement between the true and predicted boundaries.

