
Fig. 4.
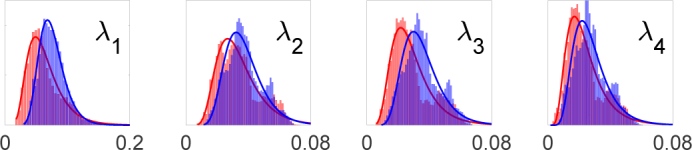
Histogram of sorted (λ1 > λ2 > λ3 > λ4) coherency matrix eigenvalues for labeled pixels in the population of 24 patients: red (healthy), blue (CIN 2-3). The y-axis is probability of occurrence and for brevity is unlabelled.
Official websites use .gov
A
.gov website belongs to an official
government organization in the United States.
Secure .gov websites use HTTPS
A lock (
) or https:// means you've safely
connected to the .gov website. Share sensitive
information only on official, secure websites.
Histogram of sorted (λ1 > λ2 > λ3 > λ4) coherency matrix eigenvalues for labeled pixels in the population of 24 patients: red (healthy), blue (CIN 2-3). The y-axis is probability of occurrence and for brevity is unlabelled.