Fig. 5.

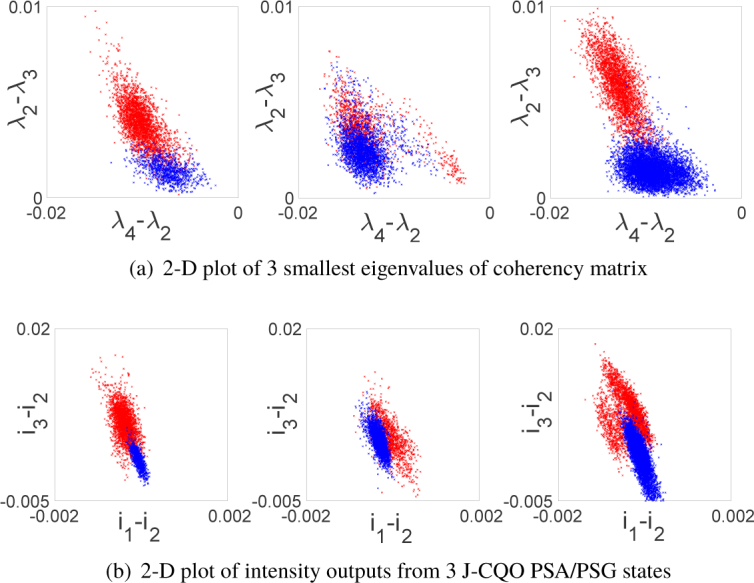
Plots of differences in: (a) 3 smallest coherency matrix eigenvalues and (b) intensity output of 3 J-CQO PSA/PSG states for patients 18, 19, and 22. Red (healthy), blue (CIN 2-3).

Plots of differences in: (a) 3 smallest coherency matrix eigenvalues and (b) intensity output of 3 J-CQO PSA/PSG states for patients 18, 19, and 22. Red (healthy), blue (CIN 2-3).