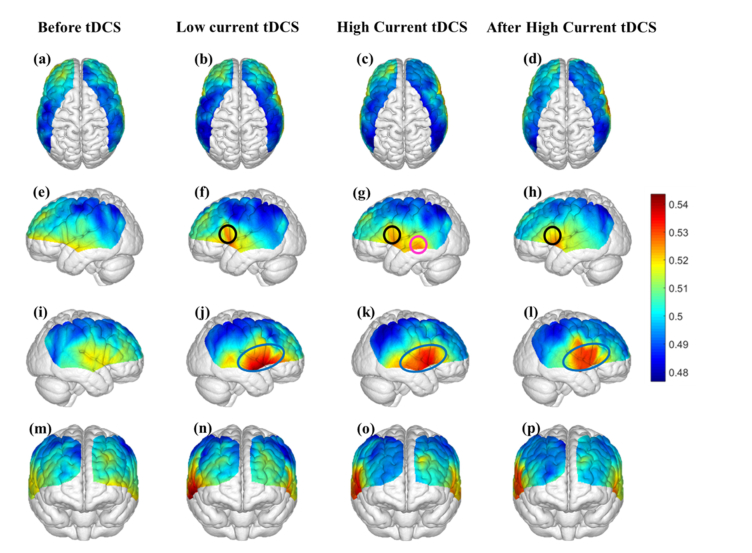
Fig. 4.
Mean dPTE for each channel displayed as a color-coded map viewed from top, left, right and front for the four stimulation sessions: Before tDCS [(a), (e), (i) and (m)], Low Current tDCS [(b), (f), (j) and (n)], High Current tDCS [(c), (g), (k) and (o)] and After High Current tDCS [(d), (h), (l) and (p)]. Hot (yellow – red) and cold (blue – green) colors indicate information outflow and inflow, respectively.

