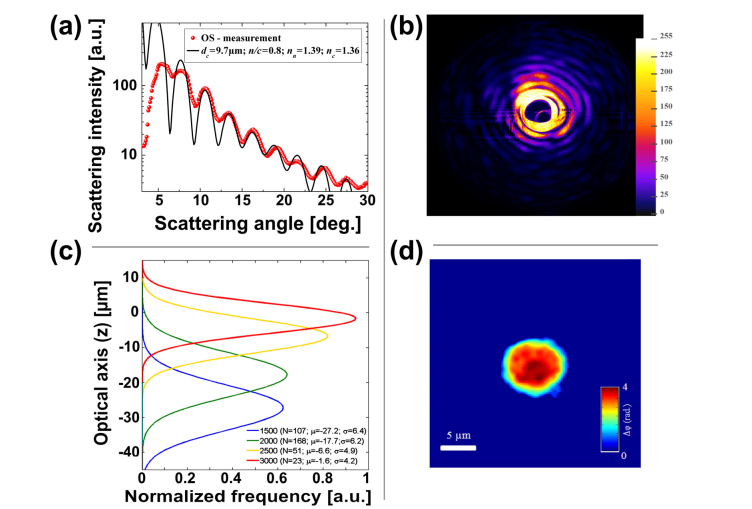
Fig. 5.
(a) LSP of monocyte measurement and overlaid simulation curve is shown. (b) The corresponding OS image recorded by the camera sensor is illustrated. (c) Optical axis results of monocytes investigated in measurement position x1. An increased cell displacement from the initial optical axis position (z = 0) is observed for decreasing ∆P values and vice-versa. (d) Phase-contrast image of a typical monocyte investigated in flow is shown. The inset shows detected nucleus content.

