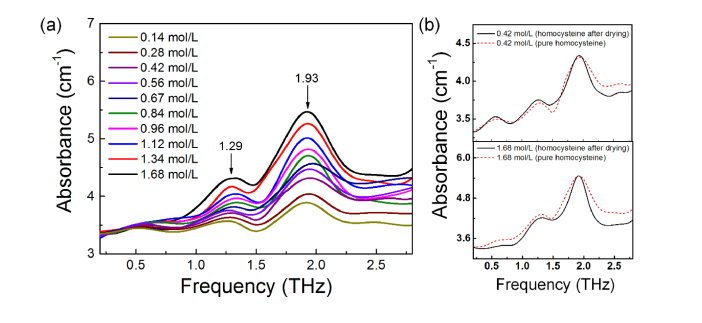
Fig. 2.
(a) THz absorption spectra of homocysteine samples under different concentrations. The corresponding concentrations are labeled with different colors. (b) Comparison of the absorption spectra of homocysteine solution after drying and that of pure homocysteine, 0.42 mol/L(upper) and 1.68mol/L (down).

