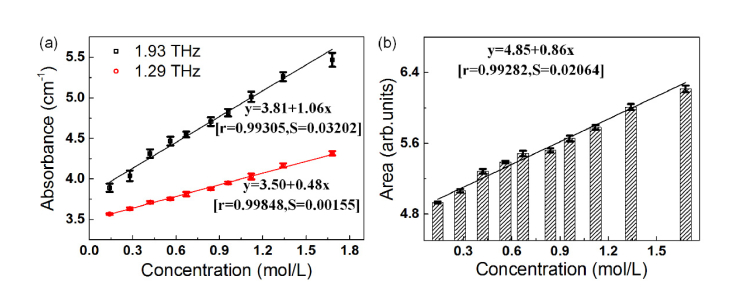
Fig. 3.
(a) The absorbance of absorption peaks at 1.29 (circles) and 1.93 THz (squares) for different concentrations of homocysteine samples, corresponding to the red and black curve, respectively. (b) The area under the absorption peaks of all homocysteine samples in the range of 0.84-2.22 THz. Each value was the average result of six measurements, and the corresponding error bars were labeled to show the standard deviations. The calculated functions are shown in the figure with the correlation coefficients (r) and the standard deviations (S). Each value was the average result of six measurements, and the corresponding error bars were labeled to demonstrate the analytical utility.

