
Extended Data Fig. 4 |. Tight junction ZO-1 is markedly reduced in the jejunum but not in the colon of Tet2−/− mice.
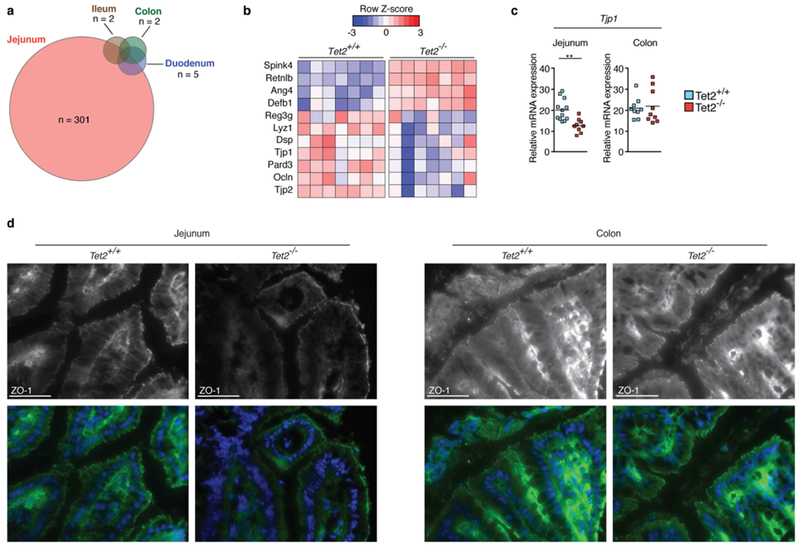
a, RNA sequencing of whole intestinal tissue of duodenum, jejunum, ileum and colon of three Tet2−/− and three Tet2+/+ mice. Venn diagram illustrating the number of differentially expressed genes (|log2(fold change)| > 0.5 and false discovery rate < 0.1); see Supplementary Table in Tet2−/− mice compared to littermate controls. b, RNA sequencing of the jejunum of seven Tet2−/− and seven Tet2+/+ mice (the full list of differentially expressed genes is shown in Supplementary Table. Heat map of a selection of antimicrobial peptides and tight junction genes. c, Gene expression of tight junction gene (ZO-1, Tjp1) in the jejunum (left; n = 12 (Tet2+/+) or 9 (Tet2−/−) mice) and colon (right; n = 9 mice in both cases). Centre is mean, two-tailed unpaired t-test. d, ZO-1 immunofluorescence shows reduced tight junction staining of epithelial cells in the jejunum (left) but no difference in colonic epithelial cells (right) of Tet2−/− mice. Representative images are shown from Tet2+/+ (n = 3 mice) and Tet2−/− mice (n = 7 mice). Scale bars, 100 μm. Green, ZO-1; blue, DAPI. **P < 0.01. Data are representative of at least two independent experiments.