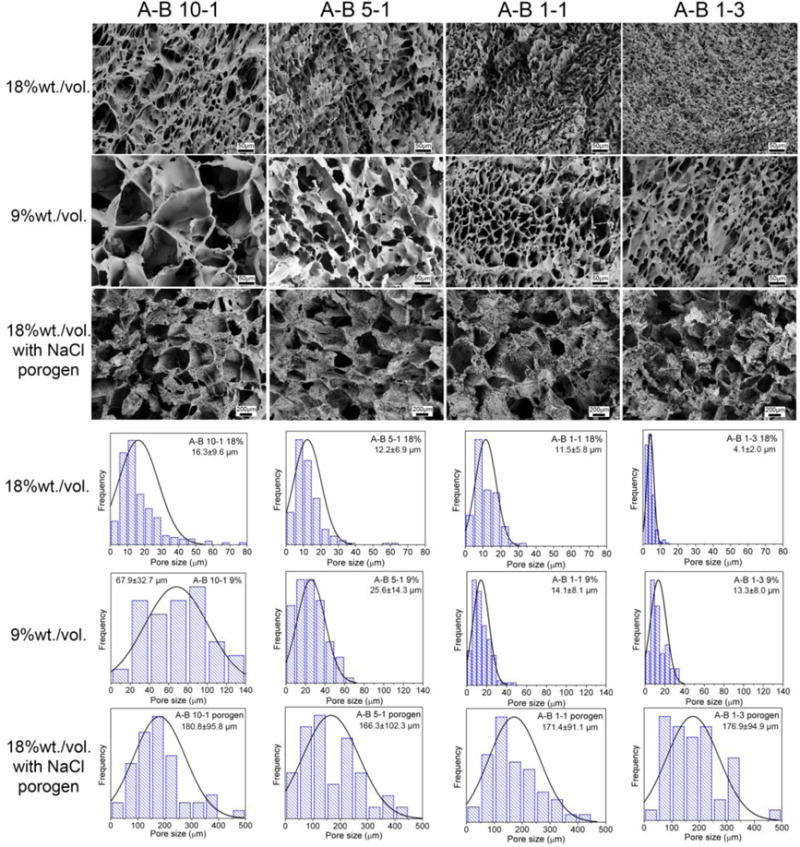
Figure 7.

Microstructure and corresponding pore size distribution results of fabricated PU scaffolds using PUs with different A to B ratios with 18% and 9% solution concentrations and with NaCl porogen. Scale bars for 18% and 9% scaffolds are 50 μm. Scale bars for scaffolds with NaCl porogen are 200 μm. The normal distribution curves are also plotted on the histograms.
