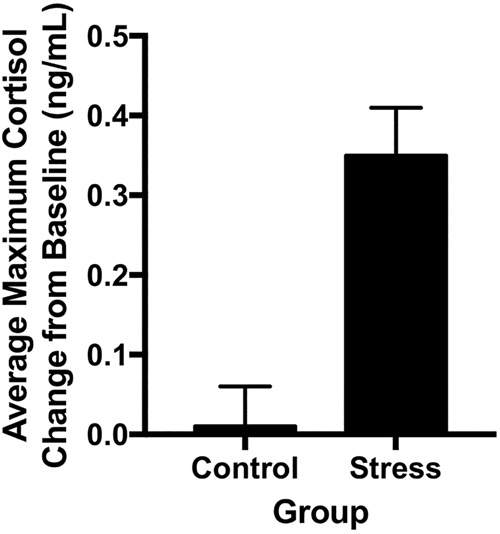
Figure 1.

Average change in cortisol in Control and Stress Groups. The Stress group demonstrated a significant increase in salivary cortisol concentration from baseline to maximum increase during the 60-min period following the task compared to the control group (P < 0.0001). Error bars represent SEM.
