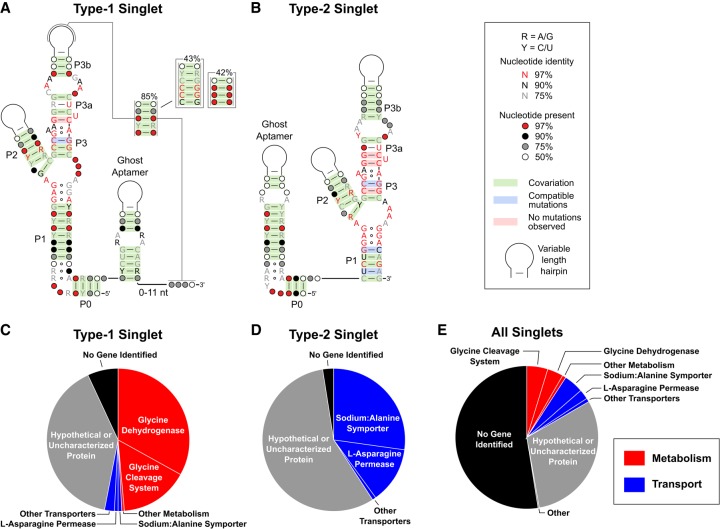
FIGURE 2.
Bioinformatic analysis of glycine riboswitch singlets. Consensus sequences are shown for the type-1 (A) and type-2 (B) glycine riboswitch singlets. Pie charts depict the relative abundance of the genes located directly downstream from the type-1 singlets (C), the type-2 singlets (D), and all identified singlets (E).

