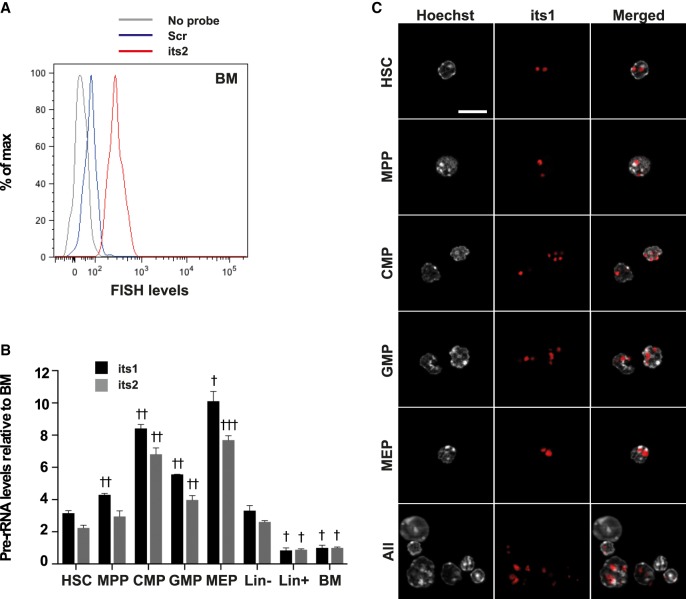
FIGURE 3.
Flow-FISH uncovers variations in pre-rRNA levels of immature hematopoietic populations. BM cells were stained using Flow-FISH with probes directed against its1 or its2 or a scramble control probe (scr). (A) FACS profile of FISH levels in the HSC population of samples stained with either no probe (gray) or the scr (blue) and its2 (red) probes. (B) Quantification of its1 and its2 levels in the indicated populations, relative to its1 and its2 levels in the BM population (HSC: Lin– Sca1+ cKit+ CD34–; MPP: Lin– Sca1+ cKit+ CD34+; CMP: Lin– Sca1+ cKit+ CD34hi; GMP: Lin– Sca1+ cKit+ CD34lo; MEP: Lin– Sca1+ cKit+ CD34lo). Statistical significance of the difference in pre-rRNA levels between HSCs and other populations of samples stained with the same probe was calculated using one-way ANOVA with Dunnett's correction for multiple comparisons: (†) P < 0.05, (††) P < 0.01, and (†††) P < 0.001. n = 3 mice; representative results of four independent experiments. (C) Lin–-depleted BM cells were stained using Flow-FISH with the its1 probe and sorted to obtain HSC, MPP, CMP, GMP, and MEP populations. Nuclei were then stained using Hoechst. Bar, 10 μm.

