
FIGURE 2.
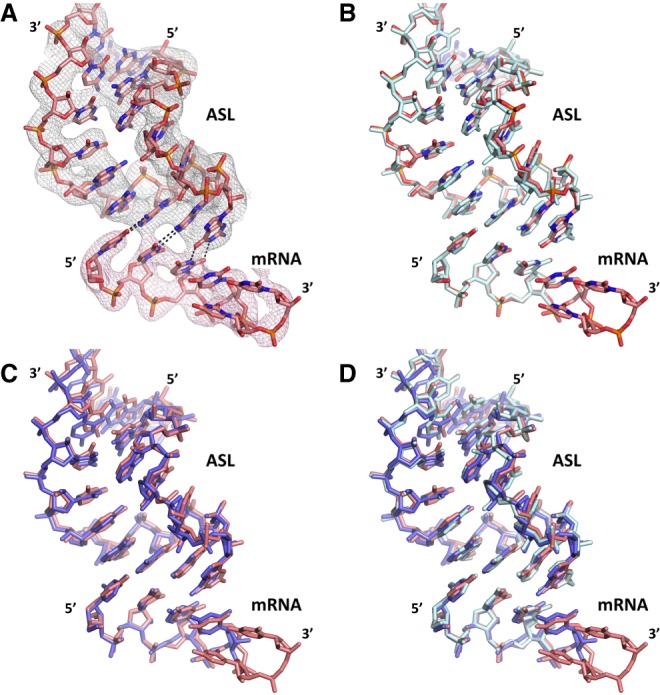
Structural comparison of ambient- and cryogenic-temperature decoding complexes. (A) Final unbiased Fo-Fc simple omit ambient temperature electron-density map of mRNA and ASL contoured at the 3σ level, colored in gray and shown at 3 Å. (B) Superposition of the ambient (salmon) and cryo (cyan) temperature structures from our group showing the agreement between them. (C) Superposition of our ambient temperature structure (salmon) and the identical cryo temperature structure obtained by another laboratory (slate; PDB ID: 1IBL) showing the agreement between them. (D) Superposition of our ambient temperature structure (salmon) with the two cryo-cooled structures (cyan and slate).