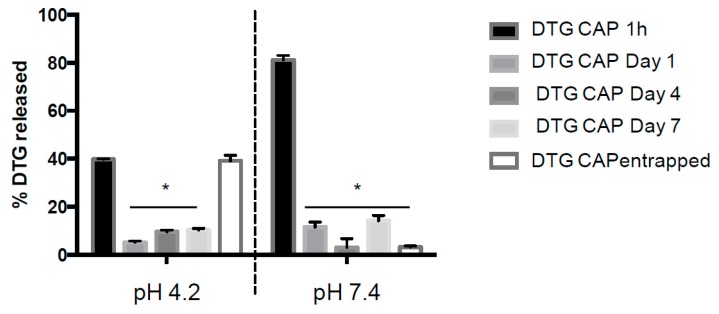
Figure 2.
Percent of Entrapped DTG Released from DTG–CAP–NP. In vitro and HPLC analysis of DTG release from DTG–CAP–NPs over a one-week time at pH 4.2 and pH 7.4. DTG–CAP entrapped represents the amount of DTG remaining entrapped in the NP at the end of the one-week experiment. Error bars represent standard error of mean (SEM). * p < 0.05.

