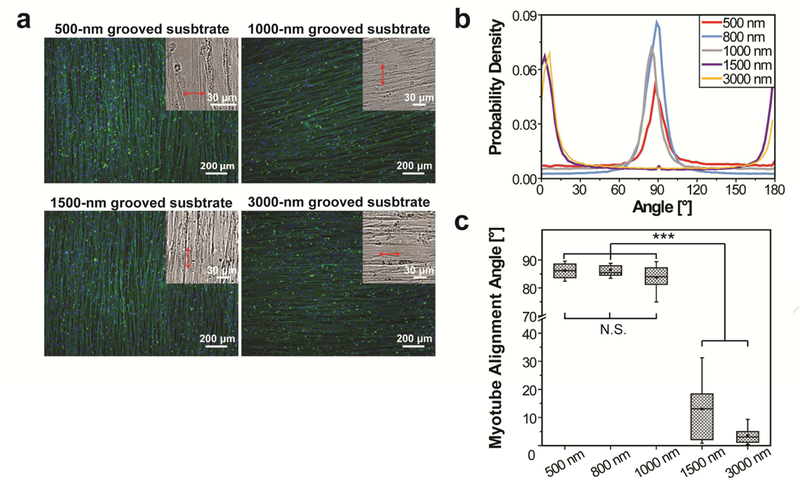
Figure 2.

The effects of the groove feature size on alignment and orientation of myotubes differentiated from hESC-derived myogenic progenitors on Matrigel-functionalized substrates. (a) Myotubes aligned in a consistent direction throughout each entire substrate, but their orientation relative to the groove direction varied with the groove feature size. Myotubes aligned nearly perpendicular to 500-nm and 1000-nm wide grooves (as those on 800-nm grooved substrates shown in Figure 1), but aligned nearly parallel to 1500-nm and 3000-nm wide grooves. Cells were immunofluorescently stained for sarcomeric α-actinin (green) and nuclei were counter-stained with Hoechst 33342 (blue). Insets: bright-field images used to determine the groove directions (arrowed red lines). (b) The p.d.f. of myotube orientations has a single, narrow, and high peak near 90° when the groove feature size is 500 nm, 800 nm, and 1000 nm and has a peak near 0°/180° when the groove feature size is 1500 nm and 3000 nm. (c) The p.d.f. curves were fitted to a Gaussian function and the revealed mean myotube orientation angles are shown as box-and-whisker plots: box marks the 25th to 75th percentiles, horizontal line marks the median, whiskers mark the minimum and maximum, dot marks the mean (n=9 for each condition). The cells were cultured for 2 weeks after differentiation induction. (N.S.= no significant difference, ***p<0.0001 by one-way ANOVA)
